


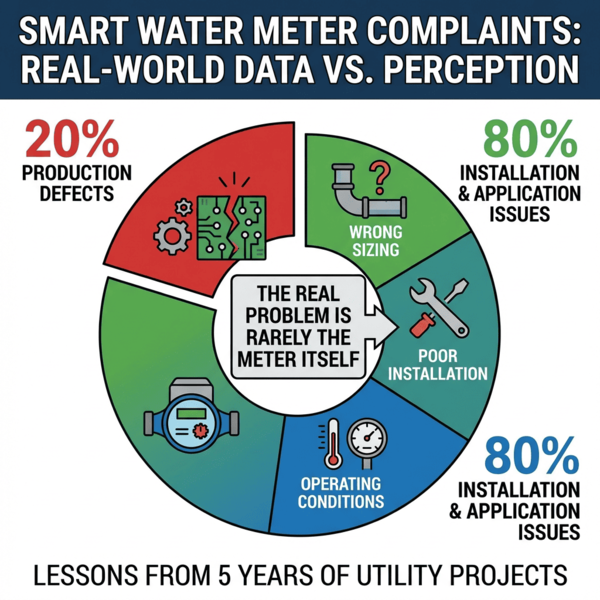
Most utilities blame the meter when complaints pile up. But after five years of real project data, I found the meter itself is rarely the real problem.
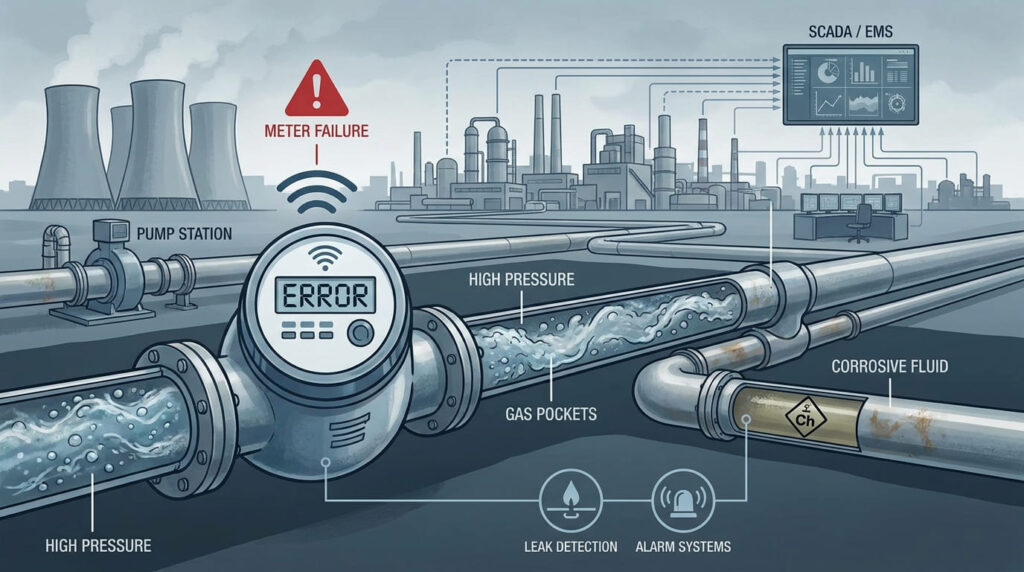
A smart water meter is a metering device with built-in electronic measurement, data logging and wireless communication. In real utility projects, less than 20% of complaints trace back to actual production defects. The majority come from wrong sizing, poor installation or operating conditions that exceed the meter’s design limits.
I have worked with utilities and project teams across Latin America, Europe and Asia for years. During that time, I collected complaint records, lab reports and field investigation results from dozens of deployments. The patterns I found changed how I think about smart metering — and I believe they will change how you think about it too. Let me walk you through what we learned.
What Is a Smart Water Meter in Real Projects?
Many people picture a shiny gadget with a screen. But in real projects, a smart water meter is a system — not just a device.
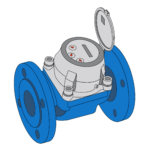
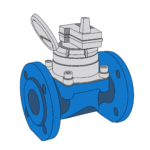
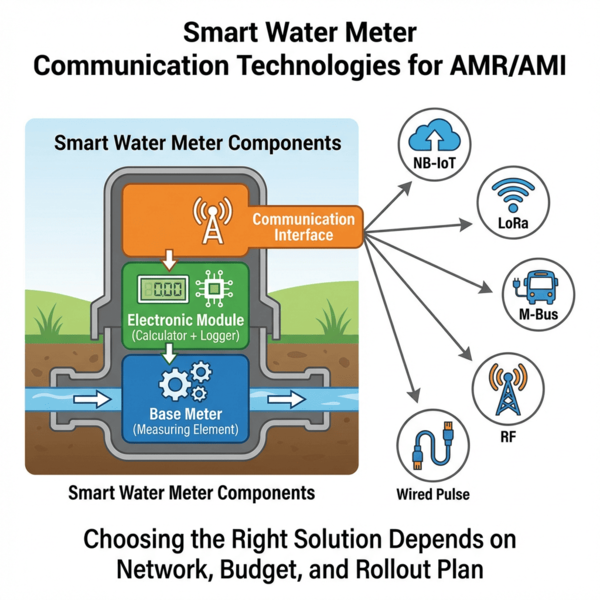
A smart water meter combines a base metering element (mechanical water meter or ultrasonic measuring principle), an electronic calculator as defined by OIML R 49, a data logger for consumption profiles and a communication module for remote reading into one unit. It measures water flow, stores consumption data and transmits readings remotely to a utility’s head-end system within an AMI architecture . It must meet ISO 4064 requirements for accuracy and durability.
What makes a smart meter different from a traditional meter?
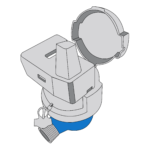
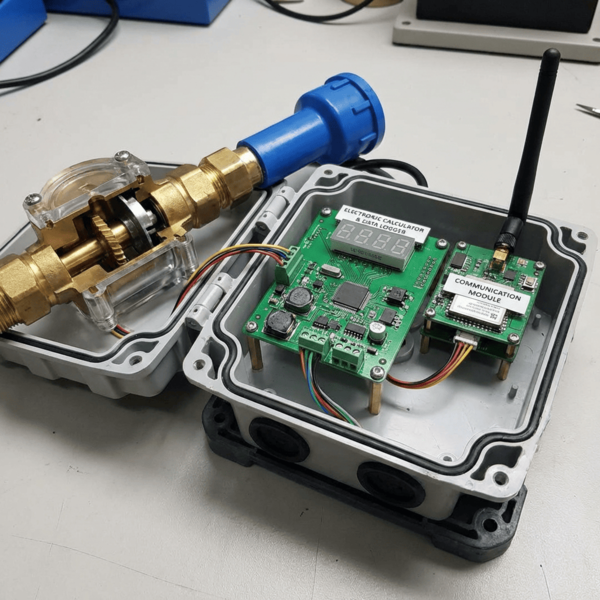
The core difference is data. A traditional meter just spins a register. A smart meter records time-stamped consumption, detects alarms like leaks or reverse flow, and sends all of this to the cloud. At YOUNIO, our residential ultrasonic smart meters like the LXCG series offer measurement ranges up to R400 (Q3/Q1 ratio per OIML/ISO), leak detection analytics, dry pipe detection and battery life over 10 years with LPWAN. But here is the key point: all these features only work correctly when the meter is properly selected and installed.
| Feature | Traditional Meter | Smart Water Meter |
|---|---|---|
| Flow measurement | Yes | Yes |
| Data logging | No | Yes |
| Remote reading | No | Yes (NB-IoT, LoRaWAN, M-Bus) |
| Leak/tamper alarm | No | Yes |
| ISO 4064 compliance | Yes | Yes |
| Depends on correct sizing | Yes | Even more so |
The electronic part of a smart meter must also pass a full set of environmental and electrical tests — dry heat, cold, damp heat, voltage variation, low battery and more (IEC 61000-4-5 surge immunity). So from a design and manufacturing standpoint, these meters are tested far more rigorously than basic mechanical meters. That is why I always tell my clients: if a smart meter passes type testing and factory calibration on an ISO 4064 bench, the odds of a true production defect reaching the field are low.
What Are the Key Components and Communication Options in the Field?
Utilities often ask me which communication technology is "best." The honest answer is: it depends on your network, your budget and your rollout plan.
A field-deployed smart water meter has three main parts: the base meter (measuring element), the electronic module (calculator + logger and the communication interface (NB-IoT, LoRaWAN, wired M-Bus per EN 13757, wireless M-Bus/OMS or wired pulse). ISO 4064 requires that if the external power fails, the meter must retain its volume indication for at least one year. The communication choice affects reading frequency, infrastructure cost and data latency.
How do you choose the right communication for your project?
I have seen projects fail not because of the meter, but because the communication plan was wrong. One utility in South America chose LoRa for a dense urban area but had no gateway budget. Another picked NB-IoT in a region with poor cellular coverage. The meter worked perfectly in both cases. The system did not.
| Communication | Best For | Typical Range | Infrastructure Needed |
|---|---|---|---|
| NB-IoT | Wide-area, low density | Cellular coverage area | Telecom network infrastructure |
| LoRa | Medium density, campus | 2–5 km (urban) | Gateways and network servers |
| M-Bus (wired) | Apartment sub-metering | Building-scale | Wired bus + concentrator |
| RF (wireless M-Bus) | Retrofit, walk-by/drive-by | 50–200 m | Handheld or mobile collector |
At YOUNIO, we design our smart meters with modular communication so you can start with walk-by RF and upgrade to LoRa or NB-IoT later. This protects your earlier investment. But each option has real-world constraints. I always recommend a small pilot — 50 to 100 meters — before committing to a city-wide rollout. That pilot will reveal signal issues, installation problems and data integration gaps that no lab test can predict.
How Do Smart Meters Work in AMR/AMI Systems?
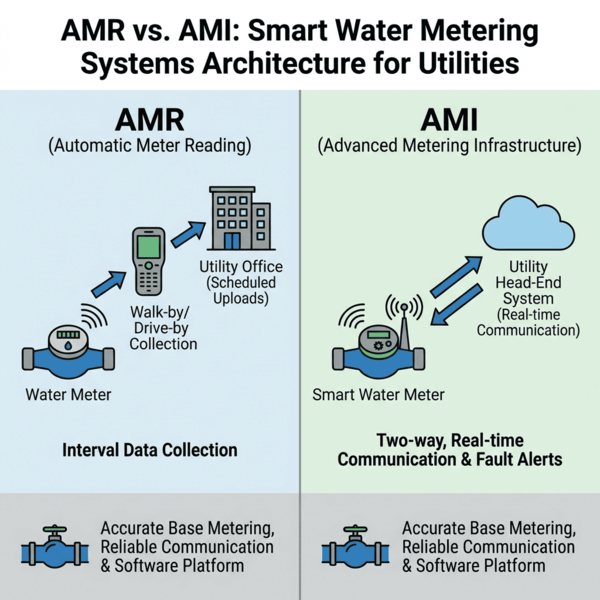
AMR and AMI sound similar. They are not. And confusing them causes real project problems.
AMR (Automatic Meter Reading) collects consumption data at intervals — typically via walk-by, drive-by or scheduled uploads. AMI (Advanced Metering Infrastructure) enables two-way, real-time communication between the meter and the utility’s head-end system. Smart water meters with electronic devices must transmit fault messages alongside data to peripheral equipment when an error condition exists. Both systems rely on accurate base metering, reliable communication and a working software platform.
What goes wrong when AMR is treated like AMI?
I have seen this mistake more than once. A utility buys meters with one-way LoRa communication, then expects real-time leak alerts and on-demand reads. That is not what the system can do. The meter is fine. The expectation is wrong. ISO 4064 requires that when a fault occurs, the meter must signal it — but only if the communication path supports it. If your system is walk-by AMR, you will not see that fault until someone physically collects the data.
| Capability | AMR | AMI |
|---|---|---|
| Remote reading | Yes (scheduled) | Yes (on-demand + scheduled) |
| Two-way communication | No | Yes |
| Real-time alarms | Limited | Yes |
| Firmware update OTA | No | Possible |
| Typical cost | Lower | Higher |
I always recommend that utilities define their actual use cases before choosing between AMR and AMI. If your goal is just to eliminate manual reading, AMR is enough. If you want real-time leak detection, dynamic pressure monitoring and demand-response billing, you need AMI. Buying AMI-capable meters for an AMR system wastes money. Buying AMR meters and expecting AMI performance causes complaints — not because the meter failed, but because the project scope was unclear from the start.
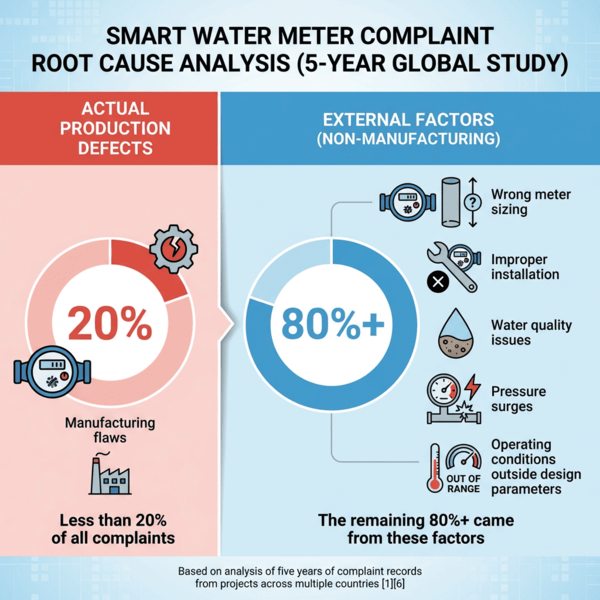
What Does Our Complaint Data Really Show — 20% vs 80%?
This is the part most manufacturers will not talk about. I will.
After analyzing five years of complaint records from projects across multiple countries, I found that less than 20% of all complaints were caused by actual production defects. The remaining 80%+ came from wrong meter sizing, improper installation, water quality issues, pressure surges or operating conditions outside the meter’s design parameters.
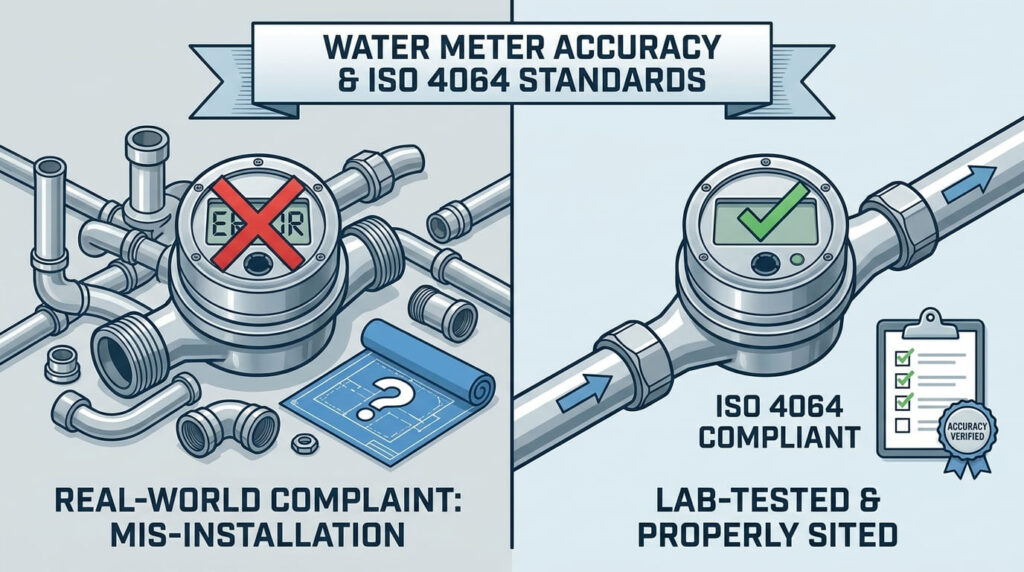
The Lab Pass / Field Fail Problem: A Real Case
One of the most misunderstood complaint types is what we call "bench discrepancy" — where a meter passes our factory test but fails at the customer’s laboratory. We’ve tracked this pattern in 15–20% of accuracy-related complaints over five years.
A concrete example: a shipment of DN50 single-jet meters to Peru passed 100% factory flow testing before shipment. After arrival, the local authority INACAL tested a sample of 10 units. Five failed — a 50% failure rate on the same meters that had passed our full inspection.
The root cause was not meter defect. Our test bench operated at 6.5 bar system pressure; INACAL’s laboratory runs at 1.0–1.3 bar. Our flow rig maxed out at 30 m³/h; their tests used 60 m³/h. Different reference conditions produce different results on the same physical meter — this is a documented ISO 4064 phenomenon called "installation platform difference."
The lesson for utilities and procurement teams: when a meter "fails" at your local lab but "passes" at the factory, the first question to ask is whether both labs are operating under the same reference conditions. The answer is often no — and aligning those conditions before the order ships eliminates an entire category of post-delivery disputes."
Why do so many complaints have nothing to do with the meter itself?
ISO 4064 defines clear operating conditions — temperature range, pressure limits, flow rate zones and environmental factor. A meter is designed and type-tested for those conditions. When the real-world installation violates those conditions, the meter will not perform as expected. That is not a defect. That is a mismatch.
| Complaint Category | Approximate Share | Typical Root Cause |
|---|---|---|
| Production defect | < 20% | Manufacturing error, component failure |
| Wrong sizing | ~25% | Meter selection errors (Q3/Q1, R-value) |
| Installation error | ~20% | Insufficient straight pipe or wrong orientation, air pockets |
| Water quality / debris | ~20% | Turbidity and sediment affecting metrology |
| Conditions beyond design | ~15% | Pressure surges and water hammer |
I remember one project where a utility replaced 5,000 meters and immediately saw a spike in "high reading" complaints from end users. They blamed the meters. We investigated. The old meters were under-registering because they were oversized and worn out. The new meters were correctly sized and accurate. The "complaint" was actually the meter doing its job. This pattern repeats in almost every large replacement program. It is not a meter problem. It is a change management problem.
Looking for a Reliable Water Meter Supplier?
YOUNIO manufactures mechanical and ultrasonic water meters from DN15 to DN500, MID-certified and tested to ISO 4064. Free samples and factory test reports available for qualified buyers.
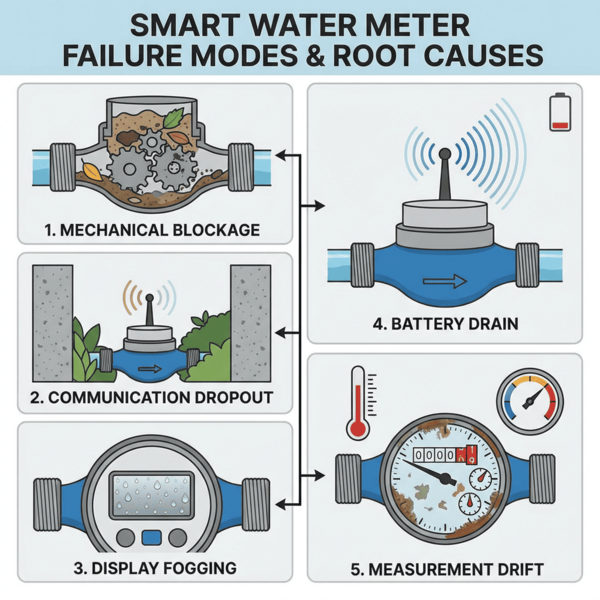
What Are the Typical Failure Scenarios and Root Causes?
Understanding failure modes helps you prevent them. Here are the patterns I see most often.
The most common field failures in smart water meters fall into five categories: mechanical blockage from debris, communication dropout from signal obstruction, display fogging from seal failure, battery drain from excessive transmission frequency, and measurement drift from prolonged exposure to conditions outside design limits.
IP68 in the Spec Sheet vs. IP68 in the Field
Display fogging deserves a closer look, because it reveals a gap between laboratory certification and field reality.
In our records, we have documented multiple cases of smart meters labeled IP68 failing IP68 immersion tests at customer facilities. In one batch of NB-IoT residential meters, the customer’s IP68 verification test — 48 hours at 1.5m depth — showed a 50% failure rate on units that had passed our own IP68 production test.
The failure mechanism was sealant adhesion. The potting compound used to seal the electronic module bonded well to the housing at production,but the bond between sealant and plastic housing degraded when subjected to daily thermal cycling — from 5°C overnight to 45°C in afternoon sun. Water and moisture found the weakened interface, entered the module cavity, and caused corrosion that disabled the communication circuit.
This is not unique to one supplier or one product. It reflects a structural limitation of how IP68 is tested: the IEC standard certifies a static soak at 23°C. It does not replicate the repeated thermal contraction and expansion that a meter experiences over years in the field.
What this means practically: when specifying smart meters for outdoor or pit installations with large temperature swings, ask the supplier for long-term thermal cycling test data — not just IP68 certification. The certificate tells you the meter was sealed on the day it was tested.It doesn’t tell you it will remain sealed after 1,000 temperature cycles.
How can you tell if a failure is a defect or a site problem?
This question comes up in almost every dispute. The answer is: look at the data and the installation. ISO 4064 Part 2 requires that when a fault is detected, the meter must signal it — and the alarm must continue until the cause is removed . So if the meter logged an alarm and the utility ignored it, that is not a meter defect. If the meter was installed in a flooded chamber and the electronics failed, that is not a production issue — even if the meter is rated IP68 ingress protection for short submersion, long-term flooding exceeds the design intent.
| Failure Mode | Likely Root Cause | How to Verify |
|---|---|---|
| Mechanical blockage | Debris, sand, construction residue | Open meter, inspect strainer and chamber |
| Communication dropout | Signal obstruction, antenna damage, wrong gateway placement | Check RSSI logs and link budget, inspect antenna, test line-of-sight |
| Display fogging | Seal damage, improper handling during install | Visual inspection, check vacuum seal |
| Battery drain | Too-frequent uploads, extreme temperatures | Check transmission log, compare with design spec |
| Measurement drift | Wear, scale buildup, conditions beyond design | Re-test on a calibration bench, compare with maximum permissible error (MPE) |
At YOUNIO, we encourage joint investigation with the utility. We share our factory test data. The utility shares site conditions and installation photos. Together, we find the real cause. This is not about blame. It is about learning. And every investigation improves the next batch.
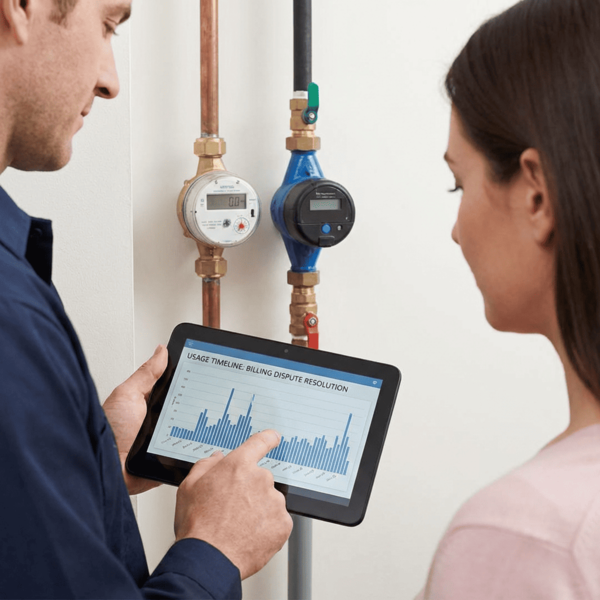
How Does Smart Data Help Resolve Disputes?
Smart meters generate data. That data is your best tool for solving complaints — if you know how to use it.
Smart water meters log time-stamped consumption, alarm events, communication status and sometimes pressure and temperature. When a complaint arises, this data creates an objective timeline that helps separate meter issues from site issues . ISO 4064 requires electronic meters to store volume data even during power or battery failure for at least one year, so the evidence is usually available.
What data points matter most in a complaint investigation?
I always start with three things: the hourly consumption profile, the alarm log and the communication log. The consumption profile tells me if there is a leak, a sudden usage spike or a pattern that matches the complaint. The alarm log tells me if the meter detected any fault — reverse flow, empty pipe, tamper or low battery. The communication log tells me if data was actually reaching the head-end system.
| Data Point | What It Reveals | Example Use |
|---|---|---|
| Hourly consumption | Leak pattern, usage behavior | Night flow > 0 suggests leak, not meter error |
| Alarm log | Fault events, tamper, reverse flow | Reverse flow and backflow issues |
| Communication log | Signal strength, upload success rate | Gaps in data → signal problem, not meter problem |
| Pressure log (if available) | Surge events, low pressure | Pressure spike → explains mechanical damage |
| Battery voltage trend | Remaining life, abnormal drain | Rapid drop → excessive upload or extreme temp |
One of my favorite cases involved a hotel that claimed our meters were over-reading by 30%. We pulled the hourly data. Between 2:00 AM and 4:00 AM, the meter recorded steady flow of 200 liters per hour — every night. The hotel had a toilet leak in a staff bathroom. No one noticed until the data proved it. The meter was accurate. The building had a plumbing problem. This is the power of smart data. It turns arguments into facts.
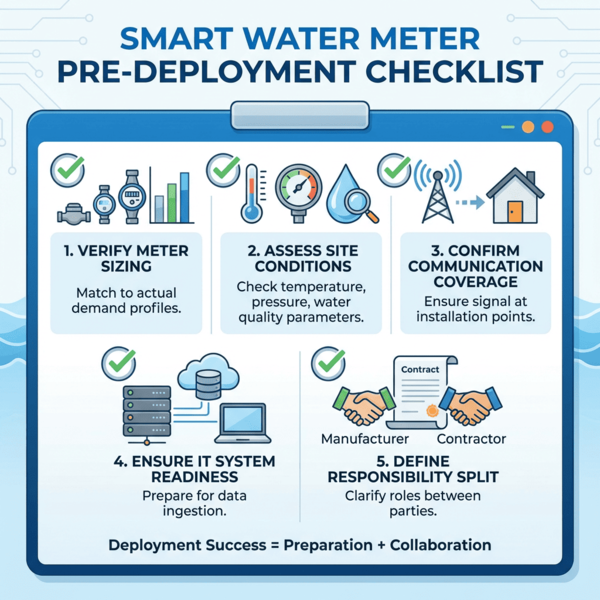
What Should You Check Before Deploying Smart Water Meters?
Deployment success depends more on preparation than on the meter itself. Here is the checklist I use with every project.
Before deploying smart water meters, verify five things: correct meter sizing based on actual demand profiles, site conditions matching the meter’s design parameters (temperature, pressure, water quality), communication coverage at installation points, IT system readiness for data ingestion, and a clear responsibility split between manufacturer and local contractor.
Why does a checklist matter more than the meter specification?
Because I have seen technically perfect meters fail in projects with no preparation. The meter specification tells you what the device can do under test conditions. The checklist tells you whether your real-world conditions match those test conditions. ISO 4064 defines performance under controlled lab settings. Your site is not a lab.
| Checklist Item | Why It Matters | Who Is Responsible |
|---|---|---|
| Demand profile analysis | Prevents oversizing / undersizing | Utility + manufacturer |
| Site survey (chamber, pipe, access) | Identifies installation risks | Local contractor + utility |
| Water quality assessment | Flags sediment, corrosion, air risks | Utility |
| Communication coverage test | Confirms signal at each install point | System integrator |
| IT / platform integration test | Ensures data flows end-to-end | IT team + manufacturer |
| Training for field installers | Reduces installation errors | Manufacturer + utility |
| Pilot phase (50–100 meters) | Catches problems before scale-up | All parties |
At YOUNIO, we provide detailed datasheets, installation manuals and type-test reports so that every item on this checklist can be verified independently. We also recommend a phased rollout — district by district — so that lessons from the first batch improve the next one. This approach has helped our partners in Brazil, Spain, Colombia, India and other markets avoid the complaint spikes that often follow large-scale replacements.
Conclusion
Most smart water meter complaints come from project issues, not production defects. Good preparation, correct sizing, proper installation and smart data analysis prevent the majority of problems before they start.
Looking for a Reliable Water Meter Supplier?
YOUNIO manufactures mechanical and ultrasonic water meters from DN15 to DN500, MID-certified and tested to ISO 4064. Free samples and factory test reports available for qualified buyers.