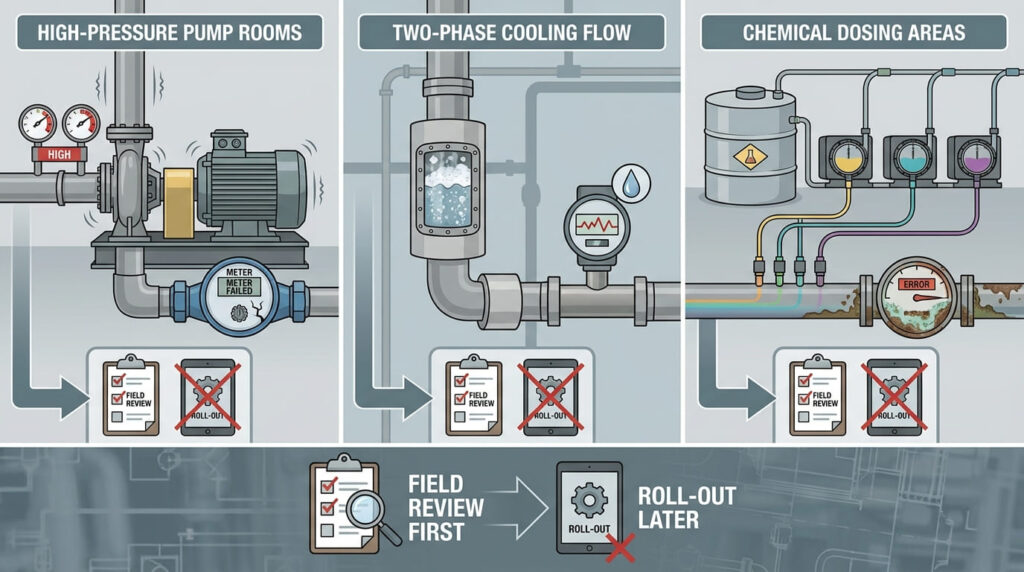




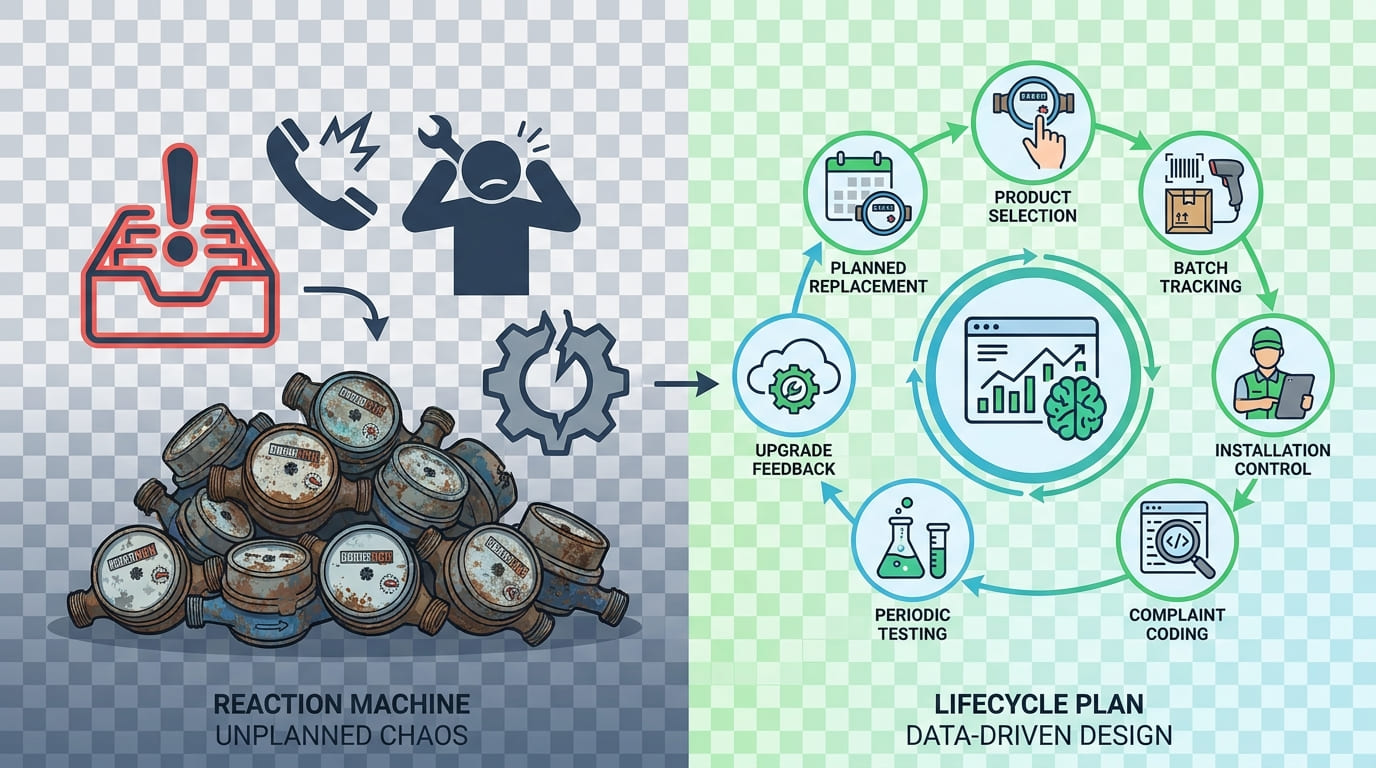
Many utilities wait until meters fail. Then complaints, emergency labor, and billing disputes arrive together. I prefer planned replacement.
A good water meter maintenance schedule design classifies meters by age, usage, meter type, complaint history, field condition, and billing risk. Planned maintenance usually lowers total ownership cost because teams replace weak meters before they create repeated disputes.
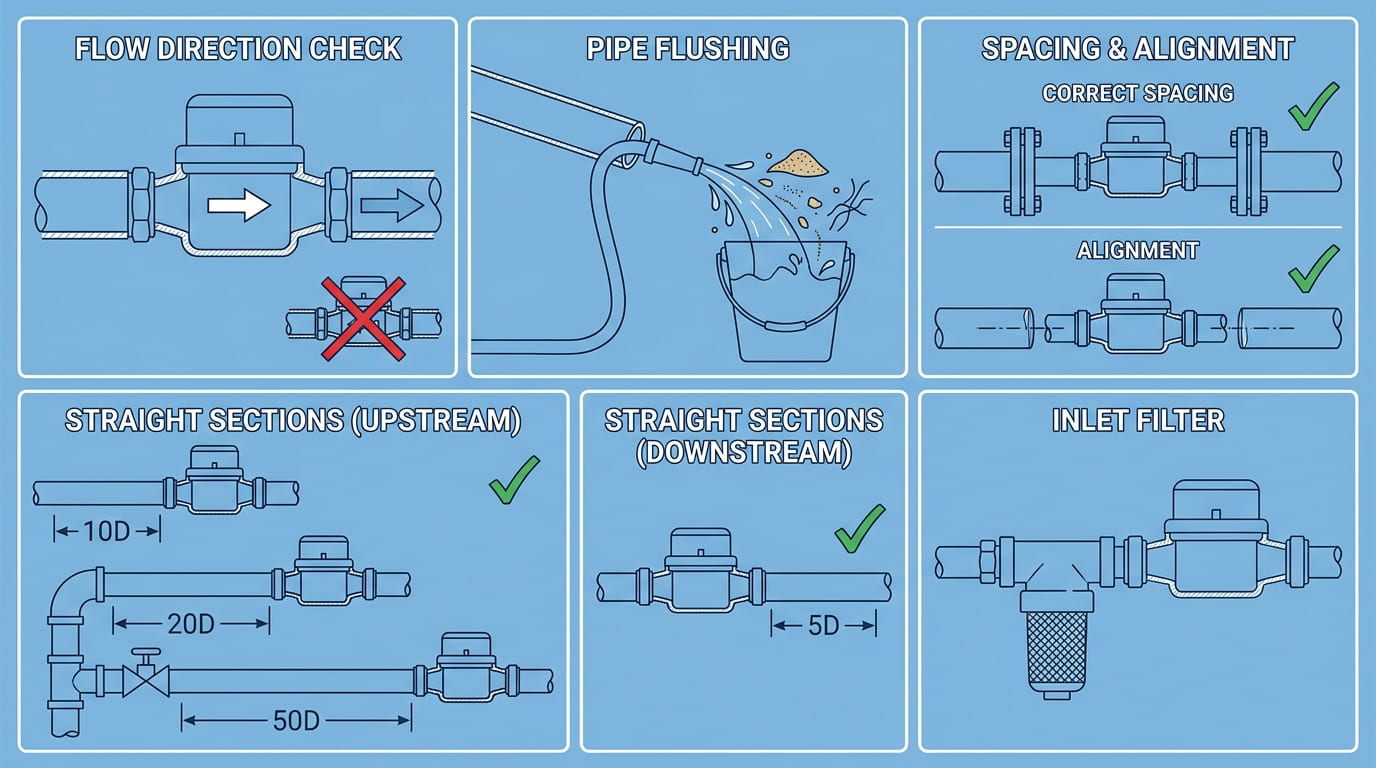
I have seen this pattern many times. The clients with the fewest complaints are not the clients with no problems. They are the clients who record problems, schedule action, and make the next maintenance cycle more accurate.
Why Is “Run to Failure” the Most Expensive Strategy?
A failed meter is not only a failed product. It becomes a billing issue, service visit, customer dispute, and emergency replacement.
“Run to failure” is expensive because it moves work from planned maintenance to reactive repair. It also increases under-registration risk, complaint handling cost, truck rolls, and trust damage.
I Count the Hidden Cost, Not Only the Meter Price
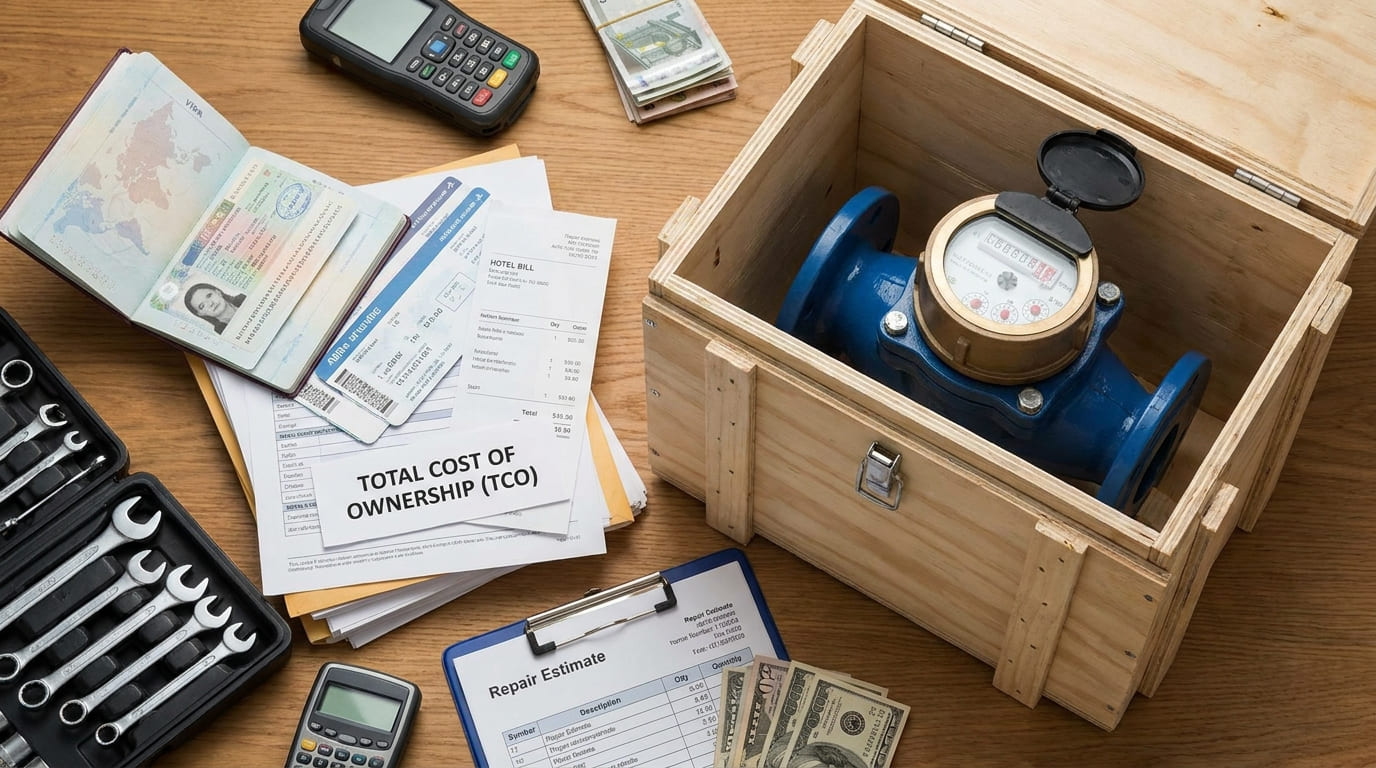
When I discuss water meter maintenance schedule design, I do not start with the price of one replacement meter. I start with the cost chain.
A failed meter may create a site visit, a customer call, a billing correction, a retest, a dispute file, a second visit, and a replacement record. If it is a smart water meter, the failure may also involve communication logs, platform checks, battery review, SIM or gateway checks, and installer verification. The meter cost is only one line.
Planned work is different. The utility can group replacements by district, meter type, age, route, or building. The installer can prepare spare parts, seals, gaskets, valves, communication tools, and customer notices. The billing team can plan the cutover date. The customer service team can explain the reason before complaints start.
I also remind teams that a meter’s ability to survive hydraulic stress is tested under defined conditions. ISO 4064-2 describes pressure testing that increases hydraulic pressure to 1.6 times the maximum admissible pressure for 15 minutes, then to twice the maximum admissible pressure for 1 minute, while checking for leakage or damage [3]. That test is useful, but it does not mean a meter should be left in service forever without review.
| Cost Area | Reactive Failure | Planned Maintenance |
|---|---|---|
| Labor | emergency dispatch | grouped route work |
| Customer contact | complaint driven | notice driven |
| Billing | dispute correction | controlled cutover |
| Testing | urgent retest | scheduled sampling |
| Stock | unplanned shortage | prepared inventory |
| Trust | customer frustration | predictable service |
I also look at apparent loss. Older meters may still run, but they may under-register under certain field conditions. The meter may not look “failed,” but the utility may still lose billing data quality.
The best clients treat maintenance as asset management. They do not ask, “Can this meter still turn?” They ask, “Is this meter still reliable enough for billing, complaint control, and total cost?”
What Are Typical Degradation Patterns by Meter Type?
Different meter types age in different ways. A single maintenance rule for every meter usually creates blind spots.
Typical degradation patterns include mechanical wear, particles, scale, register readability issues, battery decline, communication instability, valve aging, sensor drift risk, gasket aging, and damage from pressure or installation stress.
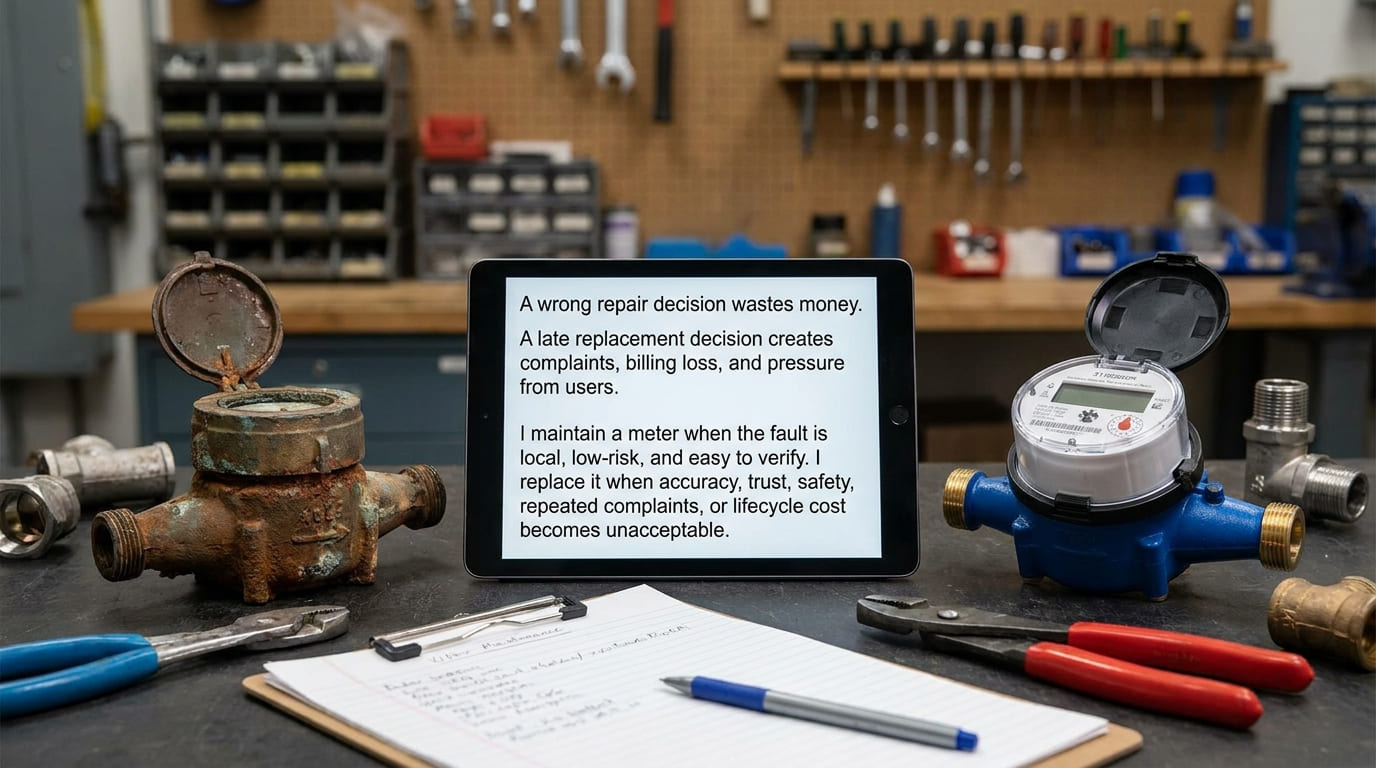
I Separate Mechanical, Static, Smart, and Large-Diameter Risks
Mechanical meters are still useful in many markets. I do not attack them. But I do check wear, friction, particles, scale, magnetic coupling condition where applicable, register readability, and low-flow under-registration risk. In difficult water quality, small particles and deposits may increase maintenance needs.
Ultrasonic and other static meters have no moving measuring parts in the measuring chamber. This can reduce mechanical wear risk. But static meters still need attention. I check battery design, electronic module sealing, sensor condition, display, cable entry, communication module, and installation environment.
Smart AMR and AMI meters add system-related risks. A communication failure is not always a meter failure. It may be caused by weak NB-IoT coverage, poor LoRa gateway placement, M-Bus wiring damage, platform mapping errors, wrong reporting cycle, or battery assumptions that do not match the project. The meter supports remote data collection, but the system must be maintained too.
Prepaid and valve-controlled meters add another layer. The valve may need periodic operation checks depending on project rules. The platform, TOKEN or recharge process where applicable, customer balance rules, low remaining water alarm, and valve command logic should be reviewed as part of the maintenance plan.
Large-diameter Woltman, turbine, or bulk meters need a different schedule. They often carry high billing or district water balance value. I check hydraulic condition, strainer condition, bypass status, pressure fluctuation, and whether the meter is operating near its normal working flow. Oversized meters may miss low flow, while undersized meters may face overload and pressure loss risk.
| Meter Type | Common Degradation Pattern | Maintenance Focus |
|---|---|---|
| Single-jet / multi-jet | wear, particles, scale | accuracy sampling and cleaning policy |
| Volumetric | chamber wear, sensitivity to particles | water quality and low-flow review |
| Woltman / turbine | bearing wear, hydraulic disturbance | flow profile and bulk billing check |
| Ultrasonic | battery, electronics, sensor path | diagnostics and sealing review |
| NB-IoT / LoRa / AMI | communication and battery | signal, reporting cycle, platform logs |
| Prepaid valve meter | valve and payment process | valve test and transaction audit |
Durability tests help manufacturers verify resistance under continuous, permanent, and overload flow conditions by subjecting meters to constant flow rates such as Q3 or Q4 for specified durations [2]. But maintenance planning should still use field age, actual usage, water quality, pressure condition, and complaint records.
What Do Our Low-Complaint Clients Do Differently?
Low-complaint clients do not simply buy better meters. They manage meter fleets better after installation.
Our low-complaint clients keep asset records, classify meter risk, sample-test older meters, replace by plan, document complaints, train installers, and review communication data for smart meter projects.
I See Discipline Before I See Technology
The lowest-complaint clients usually have a meter register. They know the model, DN size, installation date, serial number, customer type, communication method, battery assumption, and maintenance history. This sounds basic. But many complaint-heavy projects do not have this discipline.
They also classify meters by consequence. A DN15 residential meter and a DN100 commercial meter do not have the same billing risk. A meter serving a hospital, industrial park, school, shopping mall, or district inlet should not be maintained only by age. It should be maintained by value and risk.
Another difference is sampling. These clients do not remove every meter at the same time. They sample meters by age group, area, meter type, and complaint history. If the sample result shows a trend, they adjust the replacement schedule. If the sample is stable, they avoid unnecessary replacement.
They also investigate complaints with evidence. I usually ask for the serial number, site photo, installation position, pressure condition, water quality notes, and test result. For smart meters, I also ask for battery status, signal strength, upload records, gateway status, and platform logs.
ISO 4064-2 describes test installations that include water supply, pipework, flow-regulating devices, isolating valves, temperature measurement, and means for checking flow rate and test duration [2]. This reminds me that a valid technical review needs controlled evidence, not only user opinion.
| Low-Complaint Practice | What It Prevents |
|---|---|
| Meter asset database | unknown age and unknown model |
| Age and usage grouping | late replacement of high-risk meters |
| Sampling test program | invisible accuracy drift |
| Complaint coding | repeated unresolved issues |
| Installer photo records | installation-related disputes |
| Smart data review | false meter blame |
| Annual replacement budget | emergency stock shortage |
These clients also accept that the meter cannot solve every problem. It supports billing data quality and NRW reduction work, but it does not repair leaks, fix illegal connections, clean customer databases, or replace field crews.
This attitude makes cooperation smoother. When a problem appears, we can discuss evidence and correction instead of arguing from memory.
How Should You Build a Maintenance Schedule by Age and Usage?
Age matters, but usage often matters more. A busy commercial meter can age faster than a quiet residential meter.
Build the schedule by combining installation year, accumulated volume, meter type, customer class, water quality, pressure condition, complaint frequency, and billing value. Then assign inspection, sampling, or replacement actions.
I Use Risk Bands Instead of One Fixed Replacement Year
I do not like a single rule such as “replace all meters after X years.” It is simple, but it can waste budget in one area and create risk in another.
I prefer risk bands. The first band is low risk. These meters are young, installed correctly, have low complaint history, and serve lower-consequence applications. The second band is watchlist. These meters are older, heavily used, installed in difficult water quality, or have repeated customer questions. The third band is action required. These meters show high complaint frequency, poor test results, high billing value, communication instability, or visible damage.
Usage should be measured where possible. A meter with high accumulated volume has experienced more hydraulic operation than a meter with the same age but low consumption. For bulk meters, I also check whether the flow range matches the actual operating profile.
The schedule should include mechanical inspection, accuracy sampling, communication review, battery review, and replacement planning. For electronic meters, power supply and data behavior should be part of the asset file. If a meter uses NB-IoT, LoRaWAN, M-Bus, RF, RS485, pulse, or 4G Cat.1, I record the reporting cycle and system design because communication load can affect maintenance needs.
| Risk Band | Typical Condition | Recommended Action |
|---|---|---|
| Low risk | young age, normal usage, no complaints | routine record review |
| Watchlist | older age, high volume, difficult site | sampling and inspection |
| High risk | repeated complaints or poor test result | planned replacement |
| Critical | high billing value or district meter | priority test and spare plan |
| Smart system risk | upload gaps or battery alarms | communication and battery review |
Pressure history also matters. ISO 4064-2 pressure testing requires the test rig and meters to be bled of air, free from leaks, and free from pressure pulsations before hydraulic pressure testing [3]. If field records show air, pressure surge, or pulsation, I treat that site as a higher maintenance risk.
The final schedule should be practical. It should tell the team which meters to inspect, which to sample, which to replace, which spare parts to prepare, and which customer notices to send.
How Can Complaint and NRW Data Tune the Schedule?
A schedule made in the office is only the first version. Field data should improve it every year.
Complaint and NRW data tune the schedule by identifying districts, meter types, age groups, customer classes, and installation conditions that create repeated billing disputes or apparent loss risk.
I Treat Complaints as Maintenance Signals
A complaint is not only a customer service event. It is a maintenance signal.
I ask clients to code complaints by type. Is the complaint about high bill, low bill, no reading, remote reading failure, leakage, broken register, condensation, valve issue, battery alarm, reverse flow, dry pipe, or tamper event? Without categories, all complaints become noise.
Then I compare complaint data with meter age and type. If one installation year shows more problems, I check batch records. If one area shows more problems, I check water quality, pressure, and installer practice. If one communication type shows repeated upload gaps, I check network coverage, concentrator position, SIM status, reporting cycle, and platform mapping.
NRW data gives another layer. Water meters can support NRW reduction through better billing data, improved low-flow capture under defined conditions, and earlier warning. But meters do not eliminate NRW alone. Real leakage, illegal connections, pressure management, billing errors, and customer data errors still require field action.
District metering is useful here. If a district has rising minimum night flow or abnormal input-versus-billed consumption, I check the meter fleet age in that area. I also check whether customer meters are oversized, old, damaged, or installed in poor conditions.
| Data Signal | Maintenance Response |
|---|---|
| High complaints in one batch | sample test that batch |
| High complaints in one district | inspect installation and water quality |
| Rising NRW with old meters | prioritize replacement sampling |
| Remote reading gaps | check network and platform |
| Battery alarms | review reporting cycle and replacement plan |
| Repeated low-bill disputes | test low-flow performance and sizing |
| Bulk meter imbalance | verify district and customer meters |
The test environment also teaches a maintenance lesson. ISO 4064-2 describes cyclic test pipework with devices for checking flow rate, test duration, number of cycles, and inlet and outlet pressure, and it states that devices should not cause cavitation or parasitic wear [5]. In the field, cavitation, pressure disturbance, air, and poor hydraulics can also turn into complaint patterns.
A good schedule is not static. It learns from complaints, NRW trends, and retest results.
How Should You Communicate Maintenance Plans to Stakeholders?
A technically correct schedule can fail if customers, finance teams, and installers do not understand it.
Communicate maintenance plans by explaining risk, cost, customer impact, replacement priority, expected field process, data evidence, and what the meter can and cannot solve.
I Translate Technical Risk Into Clear Decisions
Different stakeholders hear different messages. Engineers care about performance. Finance teams care about cost. Customer service teams care about complaints. Installers care about site access. Customers care about fairness and interruption.
For engineers, I show meter age, usage, complaint rate, test results, and risk bands. For finance teams, I show the difference between emergency replacement and grouped maintenance. I do not promise a fixed payback period unless the project data proves it. I show the cost categories instead.
For customer service teams, I prepare simple language. “We are replacing older meters to maintain billing reliability” is better than “your meter is bad.” For installers, I prepare a route plan, meter list, serial number control, sealing method, photo requirements, and exception-report process.
For smart meter projects, I communicate system limits. The meter can support remote reading, scheduled data upload, event records, battery alarms, leakage alarms where configured, reverse flow alarms where supported, and dry pipe alarms where supported. But the project also needs communication coverage, gateway or telecom readiness, platform rules, alarm handling, and field response.
| Stakeholder | Message They Need |
|---|---|
| Utility engineer | risk bands and technical evidence |
| Finance team | planned cost versus emergency cost |
| Customer service | customer notice and complaint script |
| Installer | route, tools, photos, exception rules |
| IT team | platform, data, communication requirements |
| Procurement | approved models and spare parts |
| Management | risk reduction and service continuity |
I also explain why maintenance is not only replacement. It may include inspection, cleaning where appropriate, sampling, retesting, communication audit, battery planning, valve check, or installation correction.
The maintenance plan should be calm and factual. It should not sound like a crisis. The clients with fewer complaints usually communicate before the complaint arrives.
What Templates and Tools Help With Scheduling?
A maintenance plan becomes useful only when teams can run it every month. Templates make the plan repeatable.
Useful tools include a meter asset register, risk scoring table, sampling plan, complaint log, NRW dashboard, replacement calendar, installer checklist, and post-replacement review form.
I Keep the Tools Simple Enough to Use
I have seen complex maintenance systems fail because nobody updates them. I prefer simple templates that field teams can maintain.
The first tool is the asset register. It should include customer number, address, meter size, Q3, R value where relevant, serial number, model, installation date, meter type, communication method, battery type or design assumption, last inspection date, last test result, and complaint count.
The second tool is a risk score. I use age, accumulated volume, meter type, customer value, complaint history, water quality, pressure risk, installation condition, and communication status. Each item can be scored low, medium, or high. The total score decides inspection, sampling, or replacement.
The third tool is the complaint log. It should not be a free-text file only. It should use categories. Categories help the team see whether the issue is metrological, installation-related, communication-related, customer-service-related, or site-related.
The fourth tool is the replacement calendar. It should group work by route, district, building, or customer type. It should also show required stock, installer capacity, customer notice date, and billing cutover date.
| Template | Minimum Fields |
|---|---|
| Asset register | serial, DN, model, date, customer, communication |
| Risk score | age, usage, complaints, site, value |
| Sampling plan | group, sample size, test method, result |
| Complaint log | type, date, serial, site evidence, action |
| NRW review | district, input, billed volume, meter age |
| Replacement calendar | route, stock, installer, notice, status |
| Installer checklist | direction, access, leak check, photo |
| Review form | cause, correction, next action |
The fifth tool is the post-replacement review. After each campaign, I ask what changed. Did complaints fall? Did remote reading improve? Did billing disputes reduce? Did installers report access problems? Did the selected meter type fit the site?
These tools do not need to be expensive. A spreadsheet can start the process. A full asset management platform can come later.
The important point is consistency. A schedule that is updated every month is more valuable than a perfect plan that nobody uses.
Conclusion
Plan by age, usage, risk, and data. Specify inspection, sampling, replacement, communication checks, installer records, and post-maintenance review before complaints force action.
Need help applying this to your project?
Send your meter size, target market, and certification requirement. YOUNIO will reply with a technical checklist.