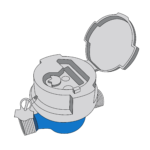

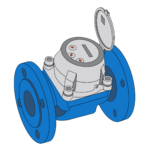

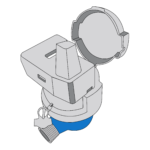

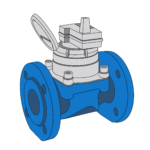

Old meters rarely fail loudly. They under-register quietly. Across a full fleet, that small loss can become larger than planned replacement cost.
Replace a water meter when age, accumulated volume, error trend, Reklamationsquote, Batteriestatus, communication failure, or district NRW data shows that continued use costs more than controlled renewal.
I do not treat replacement as a calendar decision only. I treat it as a data decision. The best utilities I work with compare meter age, Verwendung, Beschwerden, NRW, billing value, and maintenance cost before they extend service life.
What Are Typical Lifespans by Meter Technology and Size?
A meter can still display numbers and still be economically weak. If replacement is delayed too long, hidden under-registration grows.
Typical water meter lifespan depends on meter technology, DN size, Wasserqualität, Strömungsprofil, Installation, Druckzustand, Batteriedesign, and communication load. Smart meters also need battery and electronic lifecycle review.
I Separate Technical Life From Economic Life
When people ask me when to replace a water meter, I first separate two ideas. One is technical life. The other is economic life.
Technical life means the meter can still operate. Economic life means the meter still produces reliable enough data for billing, NRW analysis, complaint control, and customer trust. A meter can pass the first test and fail the second.
For residential DN15 and DN20 mechanical meters, I usually watch the fleet closely after years of service because wear, Partikel, Skala, and low-flow under-registration risk can increase. For larger DN50, DN80, DN100, and above, I pay more attention to billing value and hydraulic fit. A large commercial or district meter can create more financial impact than many small meters if it under-registers.
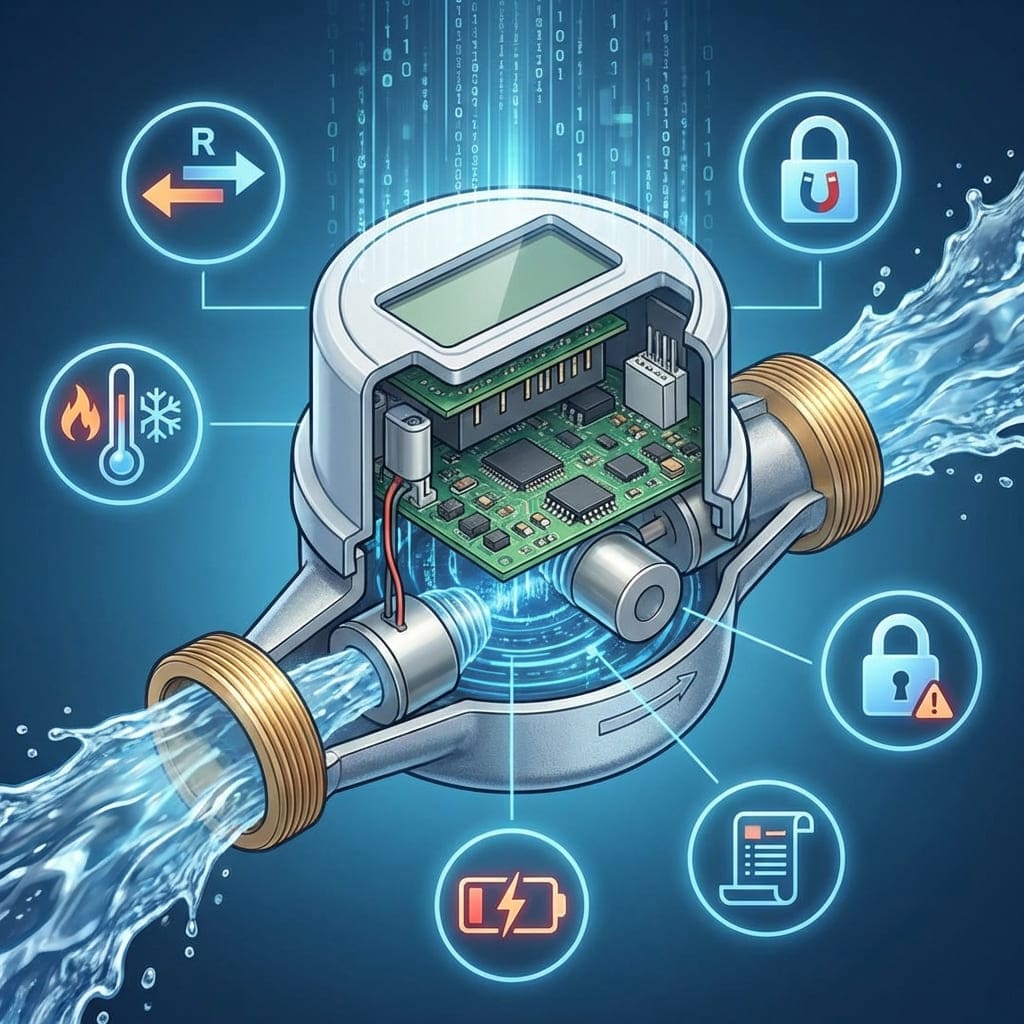
Für Smart Meter, I add power supply to the replacement logic. ISO 4064-1 states that for a non-replaceable battery, the expected battery lifetime should allow the meter to function correctly for at least one year longer than the operational lifetime of the meter [3]. For replaceable batteries, ISO 4064-1 requires the manufacturer to give precise replacement rules [1]. If the display shows a low battery indication, ISO 4064-1 requires at least 180 days of useful display life from that indication to end of life [1][3].
| Meter Group | Typical Replacement Planning Logic | Main Risk I Watch |
|---|---|---|
| DN15–DN20 mechanical residential | age plus complaint and sample-test trend | low-flow under-registration |
| DN25–DN40 commercial | age plus volume and customer value | billing dispute |
| DN50–DN100 bulk or commercial | volume, Strömungsprofil, and district balance | high revenue exposure |
| DN100+ district or industrial | criticality and verification cycle | system water balance error |
| Ultrasonic smart meters | Batterie, electronics, sensor path, Alarm | data continuity |
| Prepaid or valve meters | Batterie, Ventil, transaction record | service interruption risk |
I do not use one fixed year for every project. Wasserqualität, Druck, Installation, and actual consumption change the result. Einen Meter sauber, stable water may age differently from a meter in a line with particles, Luft, pressure surge, oder schlechte Installation.
The practical rule is this: replace by risk band, not only by age.
What Signs Show That a Meter Fleet Is Aging?
Aging is not always visible. It often appears first in data, Beschwerden, and district water balance.
Aging signs include rising complaints, falling billed consumption, more zero reads, more estimated bills, low battery alarms, communication gaps, abnormal NRW, poor sample-test results, and repeated field visits.
I Look for Patterns, Not One Complaint
One customer complaint does not prove a fleet is aging. A pattern does.
I usually start with five indicators. The first is age distribution. If a large share of meters sits beyond the planned service band, I mark the area for sampling. The second is complaint rate. If complaints rise in one district, one installation year, or one meter model, I do not ignore it. The third is billed volume trend. If customer numbers stay stable but billed consumption falls without a clear demand reason, I check under-registration risk.
The fourth indicator is NRW. Water meters do not explain all NRW. Real leakage, illegale Verbindungen, Druckmanagement, delayed repair, Abrechnungsfehler, and customer database errors also matter. But an old customer meter fleet can increase apparent loss. That is why I compare replacement history with district input and billed consumption.
The fifth indicator is smart meter health. If a meter stays offline for a long time, a field visit is recommended in the referenced maintenance guidance [2]. Another referenced maintenance document states that battery voltage below 3.2 V should lead to battery change, and that battery voltage can be viewed on the platform or LCD display [6]. These are clear operational triggers for smart meter maintenance or replacement review.
| Aging Signal | What I Check Next |
|---|---|
| More low-bill complaints | low-flow performance and meter age |
| More zero reads | stuck meter, Kommunikation, or customer vacancy |
| More estimated bills | reading failure or platform issue |
| More offline meters | Signal, Batterie, Modul, or site condition |
| Rising NRW | Leckage, scheinbarer Verlust, illegale Verbindung, database |
| Poor sample-test results | planned replacement priority |
| Batteriealarm | remaining life and battery rule |
I also ask for site photos. Sometimes the meter is not the main problem. Flooded pits, falsche Ausrichtung, moisture, direct sunlight, and poor signal can accelerate issues. One maintenance document specifically advises keeping the meter away from moisture or soaking water to avoid damage to electronic parts and using shielding or a meter box to avoid direct sunlight aging plastic parts and affecting the LCD display [6].
Aging is a fleet condition. I do not wait for every single meter to fail before acting.
What Does 2021–2025 Replacement Data Show?
Five-year data often changes the discussion. It moves the decision from opinion to cost evidence.
From 2021–2025 fleet reviews, the strongest pattern is that overextending old meters increases apparent loss, Beschwerden, and emergency work faster than planned replacement reduces cost.
I Build the Data by Cohort
When I review 2021–2025 replacement data, I do not mix all meters together. I group them by installation year, DN size, Technologie, customer type, and district.
This cohort view is more useful than a single average. A DN15 residential meter group may show many small under-registration points. A DN80 commercial meter group may show fewer units but much higher financial exposure. A smart meter group may show good measurement performance but rising communication or battery maintenance after a certain age.
The 2021–2025 pattern I often see is simple. Fleets with planned replacement have fewer emergency cases. Fleets that extend old meters too long often show more complaints, more site visits, more estimated readings, and more unexplained district imbalance. The loss is not only physical water loss. It is also apparent loss from under-registration, falsche Messwerte, and missing data.
Für Smart Meter, the battery rule must be part of the cohort analysis. ISO 4064-1 requires a low battery or exhausted battery indicator, or a meter replacement date, to be indicated on the meter for battery-powered meters [1][3]. If the project ignores these signals, the fleet may move from planned maintenance to urgent replacement.
| 2021–2025 Data Field | Why I Use It |
|---|---|
| Installation year | shows aging cohort |
| DN size | shows billing exposure |
| Meter technology | separates wear and battery risks |
| Accumulated volume | reflects usage load |
| Complaint count | shows customer impact |
| NRW by district | links meters to water balance |
| Batteriestatus | supports smart meter planning |
| Offline days | shows data reliability risk |
| Replacement reason | improves future tender rules |
I do not claim the meter alone solves NRW. It supports NRW reduction by improving billing data quality, low-flow capture under defined conditions, and data availability. The utility still needs leak repair, Druckmanagement, illegale Verbindungskontrolle, customer database cleaning, und Feldreaktion.
The key lesson from five-year data is this: the cheapest decision on paper can become the most expensive decision in the field.
How Should Revenue Loss Be Compared With Replacement Cost?
Old meters look cheap because they are already installed. That view ignores lost billing and repeated service cost.
Compare revenue loss and replacement cost by estimating under-registered volume, Tarif, affected connections, service visits, Beschwerdebearbeitung, battery work, and emergency replacement cost. Show the calculation openly.
I Always Show the Formula
I do not like vague ROI claims. I prefer a transparent calculation with assumptions.
Here is a simple example. It is not a universal result. It is only a method.
Assume a utility has 50,000 residential meters in an aging cohort. Assume field sampling suggests each meter may miss 4 L/h during low-flow periods. Assume this low-flow condition occurs for 6 hours per day. Assume the water tariff is $0.60/m³.
50,000 connections × 4 L/h × 6 h/day × 365 days ÷ 1,000
= 438,000 m³/year

438,000 m³/year × $0.60/m³
= $262,800/year
Now compare this with planned replacement. If the utility replaces 10,000 meters per year in a five-year program, it can spread procurement, installation labor, customer notice, and stock planning. I do not state a fixed payback period unless the local data proves it. Actual results depend on consumption behavior, Tarif, Auswahl des Messgeräts, installation quality, and NRW baseline.
The cost side must also include complaints. A truck roll, call center time, retest, billing correction, and customer dispute can cost more than people expect. If old meters create repeated visits, “keeping them longer” is not free.
| Economic Item | Daten erforderlich |
|---|---|
| Unterregistrierung | sample-test error and flow profile |
| Revenue impact | tariff and affected volume |
| Replacement cost | Meter, Arbeit, Siegel, notice, system update |
| Reklamationskosten | calls, visits, retests, corrections |
| Smart meter cost | Batterie, Modul, communication check |
| NRW impact | district input and billed volume |
| Risk value | commercial or critical customer exposure |
For electronic meters, power and memory also affect risk. ISO 4064-1 states that a water meter with electronic devices should preserve the meter indication before external power failure and keep it accessible for at least one year [5]. That supports data protection, but it does not mean the utility can ignore battery, Modul, or communication health.
A replacement program should be justified with both revenue and service quality. I calculate both.
What Trigger Points Should Decide Replacement?
Replacement should not depend on one manager’s opinion. It should depend on agreed trigger points.
Useful replacement triggers include age band, accumulated volume, sample-test error, rising NRW, high complaint rate, repeated offline status, low battery indication, and high customer billing exposure.
I Use Three Levels: Watch, Test, Replace
I prefer three trigger levels. They make the decision easier to defend.
The first level is watch. A meter enters this level when it reaches a planned age band, shows rising complaints, or belongs to a district with increasing NRW. No immediate replacement is required, but the meter must be visible in the asset plan.
The second level is test. A meter or cohort enters this level when complaints, NRW, or billing changes become measurable. I then use sampling. The sample should include age group, Zählertyp, DN size, customer type, and field condition.
The third level is replace. A meter or cohort reaches this level when sample-test results show unacceptable under-registration, when complaints become repeated, when communication data is not reliable, when battery rules require action, or when the cost of delay exceeds the replacement cost.
Für Smart Meter, battery and communication triggers are very direct. ISO 4064-1 requires low battery, exhausted battery, or replacement date indication for battery-powered meters [1][3]. A maintenance document also states that when the battery voltage is lower than 3.2 V, battery change should be carried out [6]. If individual meters remain offline for a long time, direct site checking is recommended [2].
| Trigger Type | Watch | Test | Replace |
|---|---|---|---|
| Alter | reaches planning band | older cohort with complaints | beyond economic life |
| Error rate | no clear trend | sample drift appears | fails agreed limit |
| NRW | stabil | rising in one district | linked to old meter cohort |
| Complaint rate | occasional | repeated by cohort | high and persistent |
| Smart battery | normal | low trend | low battery or voltage trigger |
| Kommunikation | occasional gap | repeated gaps | long-term offline |
| Customer value | normal | high exposure | critical billing risk |
I also include field triggers. Moisture, soaking water, direct sunlight, and poor signal can affect electronic parts, Kunststoffteile, LCD display, and communication performance according to the referenced maintenance guidance [6]. A poor site can move a meter into the test or replace category earlier.
The trigger table should be approved before the replacement debate starts. That keeps the decision consistent.
How Should Utilities Plan Phased Replacement Programs?
Replacing everything at once is usually unrealistic. A phased plan controls budget and field risk.
Plan phased replacement by ranking meters by risk, grouping work by district, securing stock, training installers, updating billing data, and verifying results after each phase.
I Replace the Highest-Risk Cohorts First
A good phased program starts with a map. I mark old cohorts, high NRW districts, high complaint zones, high-value customers, and smart meters with battery or communication risk.
Phase one should not always be the oldest meters. It should be the meters with the highest combined risk. A seven-year-old commercial meter with high billing value may be more urgent than an older low-use residential meter. A smart meter group with repeated offline records may need attention before a mechanical cohort with stable sample results.
I also plan the field process. The team needs meter lists, Seriennummern, Siegel, Dichtungen, Ventile, communication tools, Kundenmitteilungen, and exception rules. Für Smart Meter, the installer must confirm meter registration, platform mapping, Signal, Berichtszyklus, and battery status. The meter supports remote data, but the project also needs communication coverage, gateway or telecom readiness, Plattformregeln, und Feldreaktion.
Battery planning should be built into the phase plan. ISO 4064-1 says that replaceable battery meters require precise manufacturer rules for battery replacement [1]. A referenced maintenance document states that one GPRS meter battery design is 6+1 years when data transmission occurs every 3 Tage, which shows why reporting cycle and battery planning must be reviewed by project configuration [6].
| Phase Priority | Meter Group |
|---|---|
| Phase 1 | high NRW district and old cohort |
| Phase 2 | high-value commercial and bulk meters |
| Phase 3 | smart meters with battery or offline risk |
| Phase 4 | residential meters with rising complaints |
| Phase 5 | preventive renewal of remaining watchlist |
After each phase, I compare complaints, abgerechnetes Volumen, reading success rate, and NRW trend. I also record installation issues. If many replacements reveal flooded pits or poor access, the next phase must include civil correction, not only new meters.
A phased program works best when it learns every month.
How Can Replacement Decisions Be Communicated to Stakeholders?
Replacement can look like extra spending if the evidence is not clear. Poor communication delays good decisions.
Communicate replacement decisions with cohort data, NRW trend, Beschwerdehistorie, economic calculation, battery or communication evidence, customer impact, and a phased budget plan.
I Translate Meter Risk Into Business Language
Different stakeholders need different explanations.
Engineers need error trends, Standortbedingungen, Zählertyp, DN size, and installation records. Finance teams need revenue loss, Wiederbeschaffungskosten, emergency labor cost, and risk exposure. Customer service teams need complaint scripts. Procurement teams need clear specifications. Management needs the reason why delaying replacement is more expensive than planned renewal.
I usually show one page with five numbers: aging cohort size, complaint trend, NRW trend, estimated under-registered volume, and phased replacement cost. Then I show the formula behind the revenue estimate. This makes the decision more transparent.
Für Smart Meter, I explain that low battery and offline conditions are not vague warnings. ISO 4064-1 requires low battery or replacement date indication for battery-powered meters [1][3]. A maintenance guide recommends direct site checking when individual meters remain offline for a long time [2]. This helps stakeholders understand why replacement or maintenance should not wait until total failure.
| Stakeholder | Message I Use |
|---|---|
| Engineer | Genauigkeit, age, field condition, sampling |
| Finance | revenue loss versus phased cost |
| Kundendienst | weniger Abrechnungsstreitigkeiten |
| Beschaffung | DN, Q3, Kommunikation, Batterie, Zertifikat |
| IT-Team | platform mapping and reporting cycle |
| Management | risk reduction and service continuity |
| Customers | fair billing and planned service notice |
I avoid exaggerated claims. A new meter does not repair leaks, stop illegal connections, or clean billing databases. It improves the quality of measurement and data under defined conditions. The utility still needs field action.
The best message is practical: “We are replacing this cohort because the five-year data shows that keeping it too long costs more than planned renewal.”
Abschluss
Replace meters by age, Verwendung, error, NRW, Batterie, and complaint data. Specify phased renewal rules before old fleets create avoidable revenue loss.
Related YOUNIO products: Smart Single Jet Water Messgerät · Intelligenter Woltman-Wasserzähler
When should a utility replace a water meter?
Replace a water meter when age, accumulated volume, error trend, Reklamationsquote, Batteriestatus, communication failure, or district NRW data shows that continued use costs more than controlled renewal. Replacement is a data decision, not only a calendar decision.
What is the difference between technical life and economic life?
Technical life means the meter can still operate. Economic life means it still produces reliable enough data for billing, NRW analysis, complaint control, and customer trust. A meter can pass the first test and fail the second.
What signs show that a meter fleet is aging?
Aging signs include rising complaints, falling billed consumption, more zero reads, more estimated bills, low battery alarms, communication gaps, abnormal NRW, poor sample-test results, and repeated field visits. Look for patterns by district, installation year, or meter model—not one complaint alone.
What did 2021–2025 fleet reviews show about delaying replacement?
Overextending old meters increases apparent loss, Beschwerden, and emergency work faster than planned replacement reduces cost. Fleets with planned replacement have fewer emergency cases; delayed fleets often show more estimated readings and unexplained district imbalance.
What trigger levels help decide watch, prüfen, oder ersetzen?
Use three levels: watch when a meter reaches a planned age band or sits in a rising-NRW district; test when complaints, NRW, or billing changes become measurable and sampling is needed; replace when sample-test under-registration, wiederholte Beschwerden, unreliable communication, Batterieregeln, or delay cost exceed renewal cost.
Need help applying this to your project?
Send your meter size, target market, and certification requirement. YOUNIO will reply with a technical checklist.