


Eau non facturée (NRW) mange les budgets des services publics. Je vois les managers blâmer les compteurs, blâmer les utilisateurs, et blâmer les tuyaux. La vérité se cache généralement dans des données que personne n’a encore collectées.
J'utilise des solutions intelligentes de comptage urbain de l'eau non payante pour transformer les suppositions en preuves. Some "low reading" les plaintes s'avèrent être des changements de canalisations ou des contournements illégaux, et les journaux d'événements des compteurs intelligents aident à restaurer la véritable histoire.

Je travaille avec des services publics qui soupçonnent un vol, fuites, ou des erreurs de compteur mais ne peut en prouver aucune. Sans zone de comptage de district (DMLA) et compteurs intelligents, chaque plainte devient une longue dispute. Avec les données DMA et les journaux d'événements, la conversation passe de l'émotion à la preuve. Dans cet article, Je partage ce que j'apprends des projets à problèmes, comment je construis un équilibre hydrique, comment repérer les connexions illégales avec les données d'événements, et comment déployer les DMA étape par étape.
Qu'est-ce qu'une zone mesurée par district (DMLA)?
Un DMA est un petit, tranche mesurable du réseau. I cut the big pipe map into sections I can actually monitor.
I define a DMA as a zone with known inlets and outlets, where every inflow is metered and every large user is submetered. This lets me compare input water with billed water and find the gap.

Why I Break the Network Into Zones
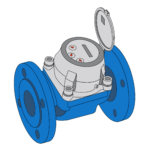
I break a network into zones because one big meter at the source tells me almost nothing. I cannot see where the loss happens. Inside a DMA, I install smart meters at the inlet and at key users, and I connect them to a monitoring system. The smart ultrasonic meter can relate to a GSM wireless data collector and use the GSM mobile public network for data transmission to form a wireless monitoring system, and when the pipeline network runs abnormally, it actively reports the abnormal information of the pipeline network. With a Lora version, the meter can also connect to a concentrator, and the wireless data collector uses GSM mobile or Ethernet network for data transmission. This zone-by-zone setup turns a blind network into a measurable one, and it is the base for every NRW action that follows.
| DMA element | What I install | Pourquoi c'est important |
|---|---|---|
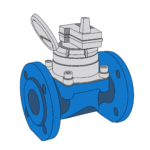
| Inlet | Smart bulk meter | Measures total input |
| Large users | Smart submeters | Splits known demand |
| Communication | GSM / LoRa / Ethernet | Surveillance à distance |
| Alarmes | Event-based reporting | Finds abnormal flow |
Building a Water Balance with Smart Meters?
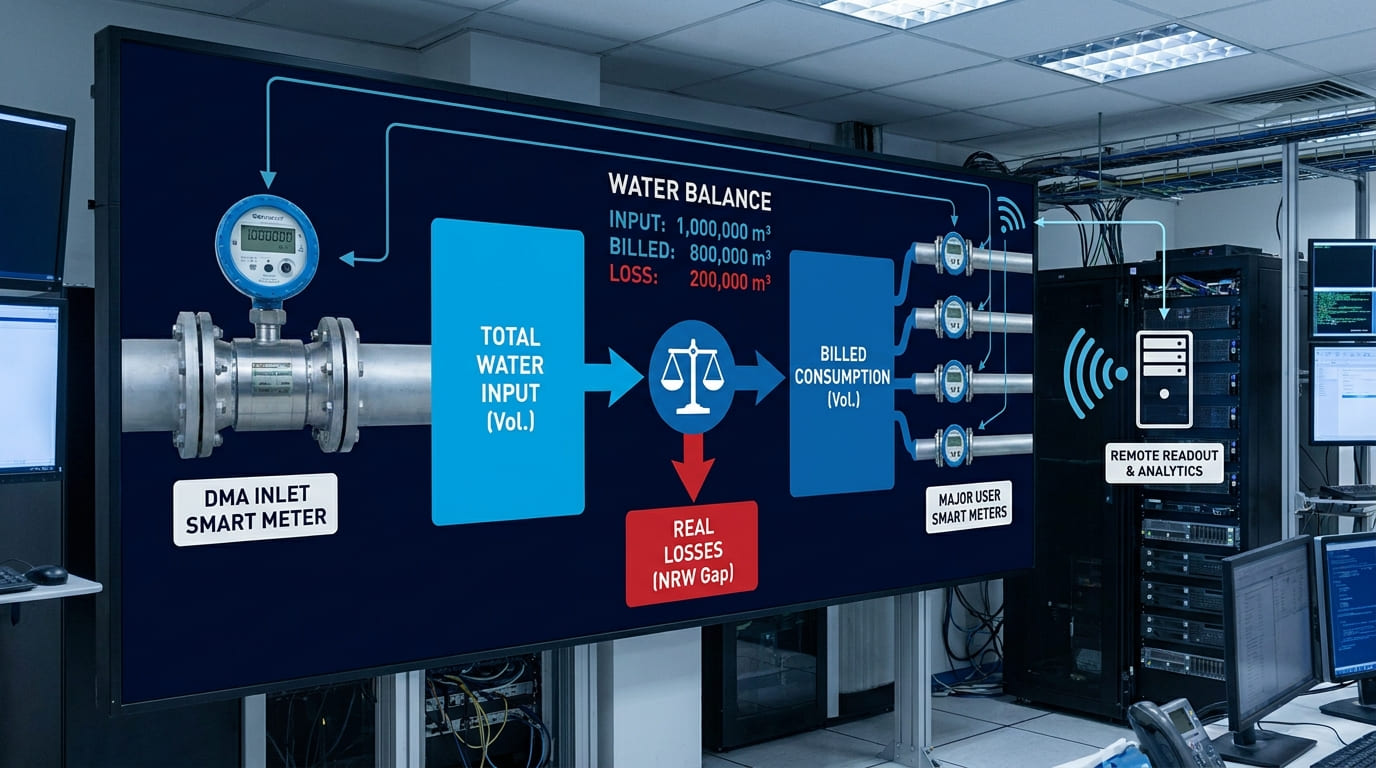
A water balance is the core of any NRW program. Input minus billed use equals loss, in simple words.
I build a water balance with smart meters at the DMA inlet and at major users, and I read them remotely. The gap between input and billed volume shows real losses, pas devinés.
Comment je collecte les numéros
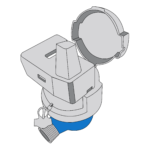
Je collecte les numéros du menu du compteur et du système de surveillance. Sur chaque compteur intelligent, les utilisateurs peuvent changer d'écran d'affichage avec une tige magnétique et visualiser le débit instantané (m³/heure), flux cumulé (m³), détection d'écran, adresse du tableau, temps de travail cumulé (h), date, calibre, et version du logiciel. Pour un DMA, Je n'ai besoin que de deux groupes de chiffres: le débit cumulé d'entrée et la somme des débits cumulés des utilisateurs sur la même période. La différence est ma perte apparente et ma perte réelle. Pour la collecte à distance, le compteur intelligent rapporte les données via le système de surveillance sans fil GSM, ce qui évite la lecture manuelle et me donne une base de temps cohérente. Je respecte les normes pour les compteurs eux-mêmes: ISO 4064:2014, OIML R49-2013, MILIEU, et GB/T 778.1/2/3-2007 pour canalisations fermées et pleines, installation, et méthodes de test. Avec une base de temps propre et des compteurs certifiés, my balance is defensible in front of tender committees and auditors.
| Number I need | Source | How I read it |
|---|---|---|
| Input volume | DMA inlet meter | Flux cumulé (m³) |
| Billed volume | User submeters | Flux cumulé (m³) |
| Time base | System clock | Date on meter menu |
| Transmission | GSM / Ethernet | Wireless monitoring |
Typical NRW Sources Revealed by DMA Data?
Once a DMA runs, the real sources of loss show up fast. I stop arguing and start reading.
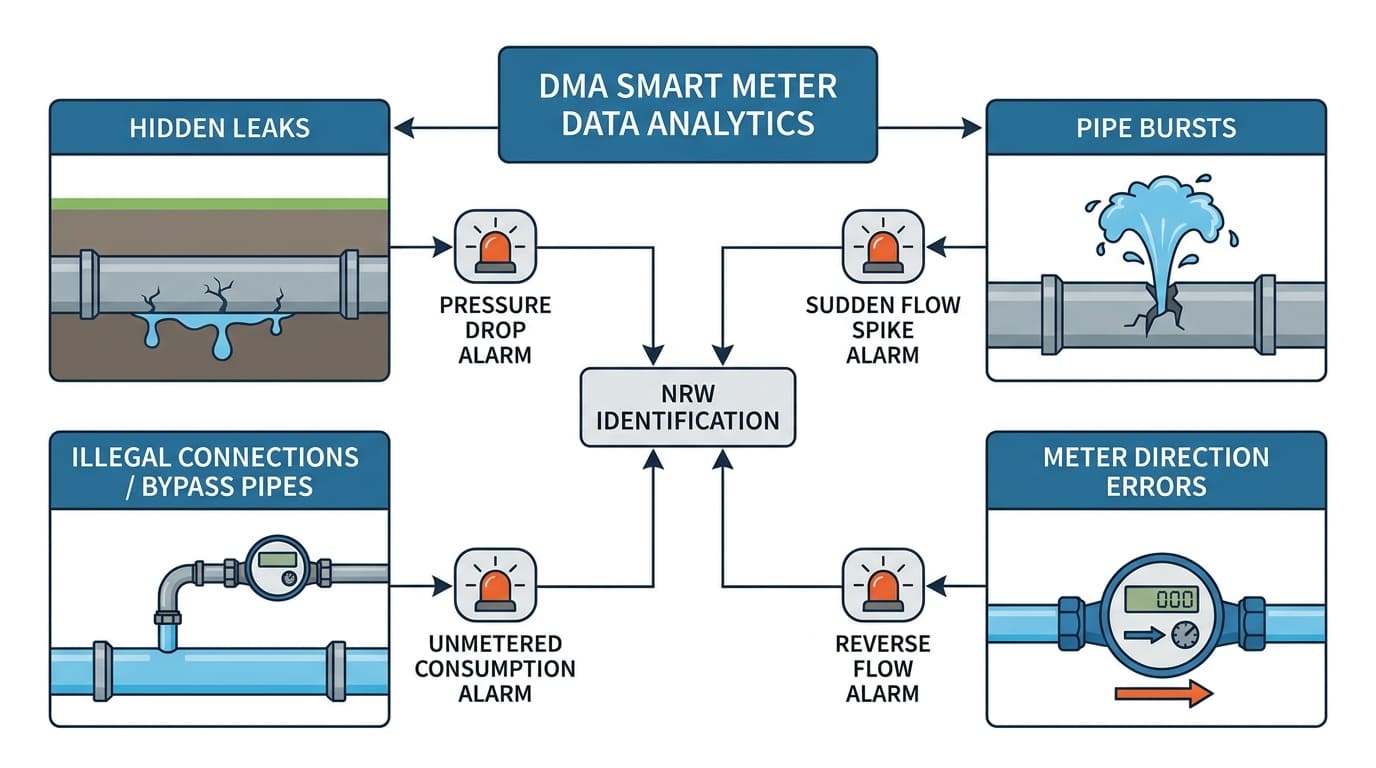
I see four common NRW sources from DMA data: hidden leaks, pipe bursts, illegal connections or bypass pipes, and meter direction errors. Smart meter alarms point to each of them.
What the Alarms Actually Tell Me
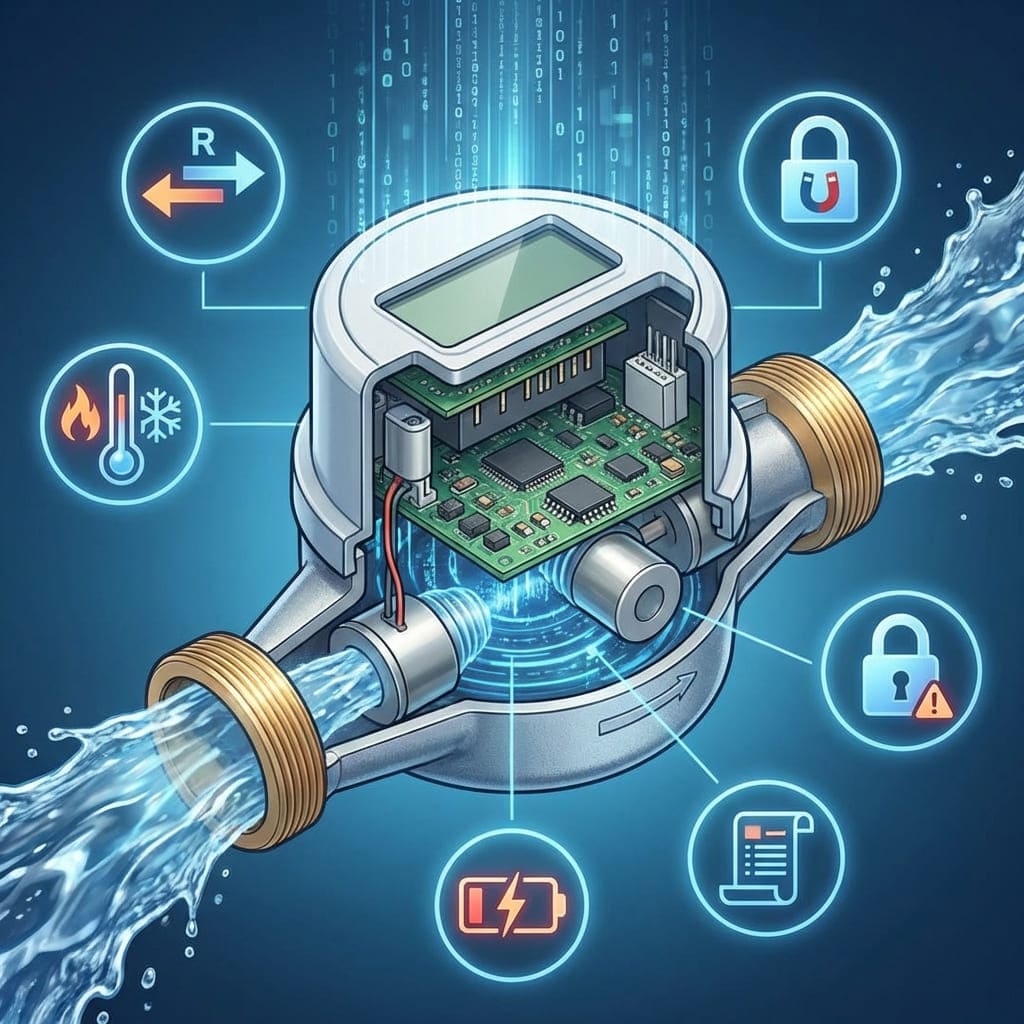
I map each alarm to an NRW source. When the flow signal shows water running for a long time, tel que 24 heures, the system actively reports the error and alarms, and I treat this as a pipeline leak signal. Lorsque le signal de débit indique un débit d'eau important pendant une longue période, avec débit d'eau et durée réglés par l'opérateur, le système signale et stocke l'erreur et les alarmes, et je traite cela comme une rupture de pipeline. Lorsque le compteur d’eau est installé dans le mauvais sens, le système signale et stocke activement les erreurs et les alarmes, ce qui expose souvent des changements de canalisations non autorisés du côté de l'utilisateur. Lorsqu'il n'y a pas d'eau dans la canalisation et aucun signal dans le transducteur, le système rapporte, magasins, et les alarmes aussi, ce qui m'aide à récupérer les sections sèches ou les vannes fermées. Chaque alarme transforme un numéro NRW abstrait en un ticket de terrain concret.
| Source NRW | Alarme utilisée | Cause fondamentale typique |
|---|---|---|
| Fuite cachée | Alarme débit long (24h) | Fissure de canalisation enterrée |
| Éclatement | Alarme gros débit | Pause principale |
| Connexion illégale | Alarme de direction | Tuyau inversé ou bypass |
| Section fermée/vide | Alarme de manque de débit | Vanne ou ligne sèche |
À la recherche d’un fournisseur de compteurs d’eau fiable?
YOUNIO fabrique des compteurs d'eau mécaniques et ultrasoniques du DN15 au DN500, Certifié MID et testé selon ISO 4064. Échantillons gratuits et rapports de tests en usine disponibles pour les acheteurs qualifiés.
Études de cas: Du soupçon à la preuve basée sur les données?
J'ai vu des projets où le personnel soupçonnait un vol pendant des années. Sans données, ils ne pouvaient pas agir. Avec DMA et compteurs intelligents, la vérité est sortie en quelques semaines.
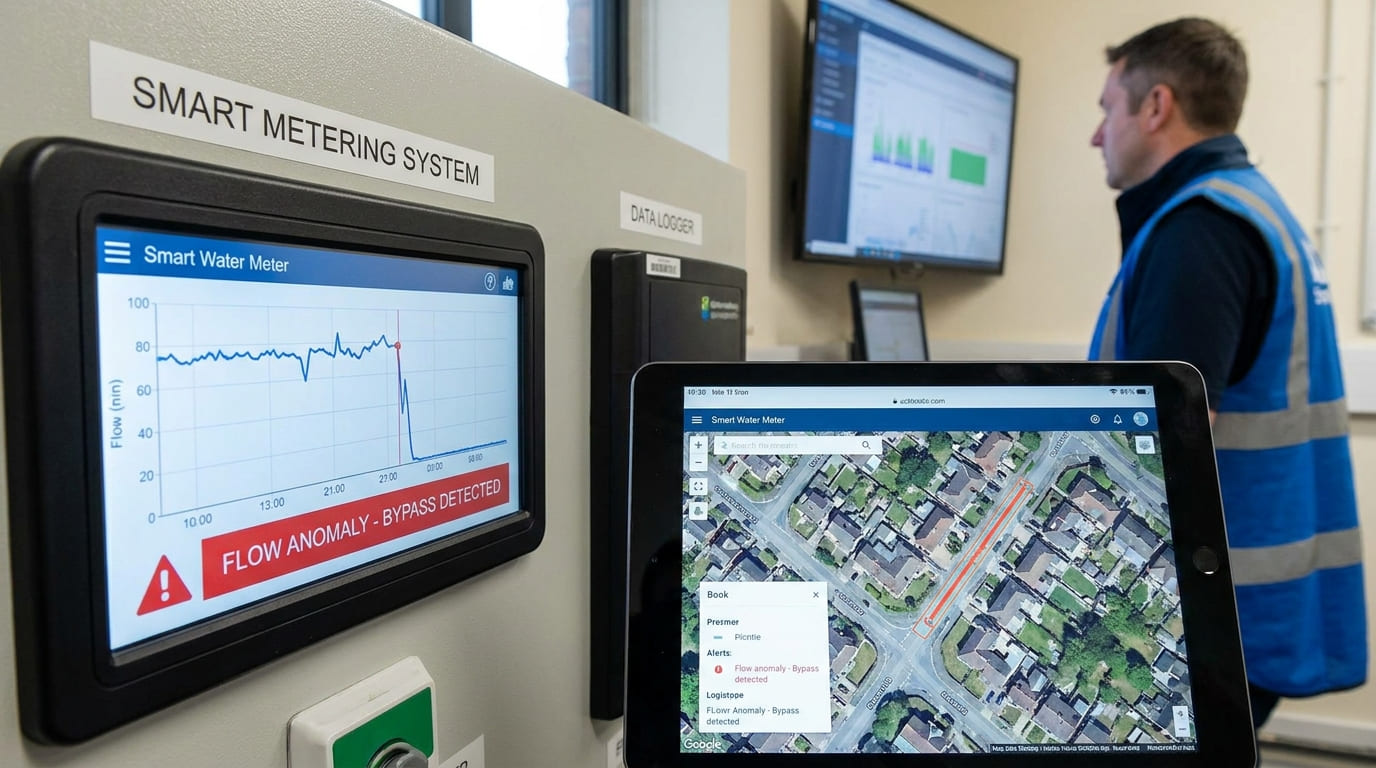
I use case patterns where "low reading" les plaintes ressemblaient à des pannes de compteurs mais se sont avérées être des changements de conduites illégaux ou des contournements. Smart meter event logs restored the real story and protected the utility’s reputation.
Des modèles que je rencontre encore et encore
Je décris trois modèles que je rencontre dans des projets problématiques. Dans le premier, un utilisateur s'est plaint que le compteur affichait un niveau trop bas après une nouvelle installation. Une vérification sur le terrain a montré que l'alarme de direction du compteur s'était déclenchée., ce qui signifie que le compteur a été installé dans le mauvais sens, ce qui peut arriver après un travail de tuyauterie non autorisé. Dans la seconde, un DMA a montré un débit nocturne stable qui n'est pas tombé à près de zéro. L'alarme de débit long d'un sous-compteur spécifique a indiqué une fuite enterrée après 24 heures de flux continu. Dans le troisième, a large user’s cumulative flow looked normal, mais le solde du DMA montre encore de grosses pertes. By reading each smart meter’s menu — instantaneous flow, flux cumulé, temps de travail, et date — j'ai trouvé un mètre avec presque aucun temps de travail, qui faisait allusion à un tuyau de dérivation alimentant en eau non mesurée. Dans chaque cas, Je suis passé du soupçon à la preuve car le compteur stockait et signalait activement les événements..
| Soupçon | Des données qui l'ont prouvé | Action |
|---|---|---|
| Compteur trop bas | Alarme de direction | Réinstaller, tuyau d'audit |
| Déchets cachés | Alarme débit long | Trouver et réparer une fuite |
| Tuyau de dérivation | Faible temps de travail au compteur | Inspecter les locaux des utilisateurs |
Utilisation d'événements et d'alarmes pour détecter les connexions illégales?
Les connexions et contournements illégaux sont la source la plus difficile à combattre en NRW. J'ai besoin de données avec lesquelles un utilisateur ne peut pas discuter.
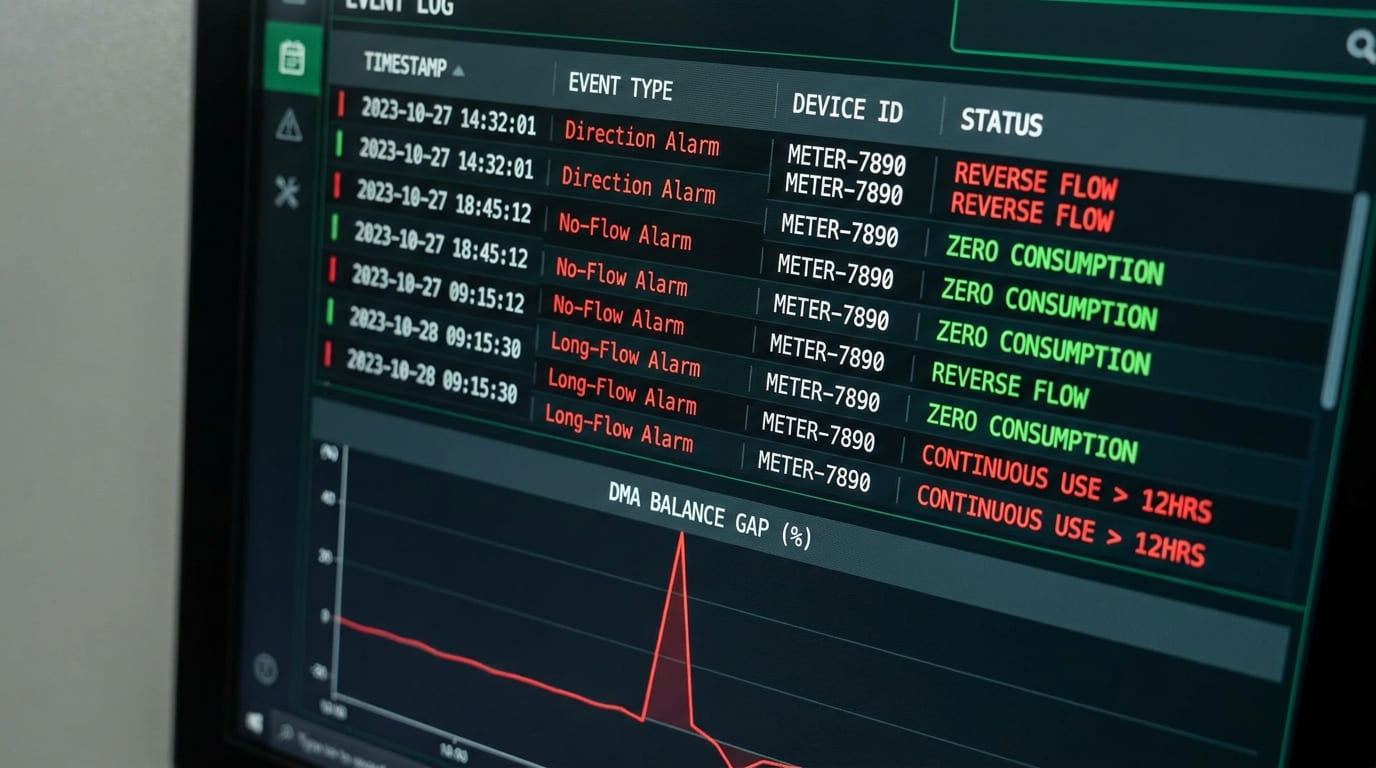
J'utilise les événements des compteurs intelligents – alarmes de direction, alarmes d'absence de débit, alarmes à long débit — plus des écarts d'équilibre DMA pour indiquer des connexions illégales. Les journaux d'événements stockés me donnent une chronologie qui tient en cas de litige.
Comment construire une chaîne de preuves
Je construis une chaîne de preuves à partir de trois couches. La première couche est le compteur lui-même. Le compteur à ultrasons intelligent signale activement les informations anormales du réseau de pipelines au système de surveillance, et l'état de la batterie est également visible: quand la batterie est faible, l'écran LCD affiche un symbole de batterie faible et transmet l'information au système de gestion. La deuxième couche est le type d'événement. La détection du sens du flux signale un événement de sens inversé, ce qui est un signe fort de falsification ou de contournement. La détection de flux signale les événements sans signal, ce qui m'aide à vérifier si quelqu'un a fermé une vanne et ouvert un chemin non mesuré. La détection des fuites et des éclatements de pipeline ajoute du contexte autour de la fenêtre temporelle. La troisième couche est la balance DMA. Si le volume d'entrée ne correspond pas à la somme des volumes utilisateur, et un utilisateur dispose d'une alarme de direction en même temps, J'ai aligné les preuves. Parce que l'installation doit suivre la conception technique professionnelle du site et toute modification sans l'autorisation de l'ingénieur est strictement interdite, toute modification non autorisée devient une rupture de contrat évidente.
| Couche de preuves | Point de données | Pourquoi c'est important |
|---|---|---|
| Mètre | Rapport d'anomalie actif | Signal en temps réel |
| Événement | Direction / alarme d'absence de débit | Indicateur de falsification |
| Équilibre | Entrée DMA vs. somme d'utilisateurs | Quantifie l'écart |
| Règle | Conformité de la conception technique | Base juridique |
Cadre KPI pour les projets NRW?
Sans KPI, un projet NRW dérive. Je définis un petit ensemble de chiffres et je les suis chaque mois.
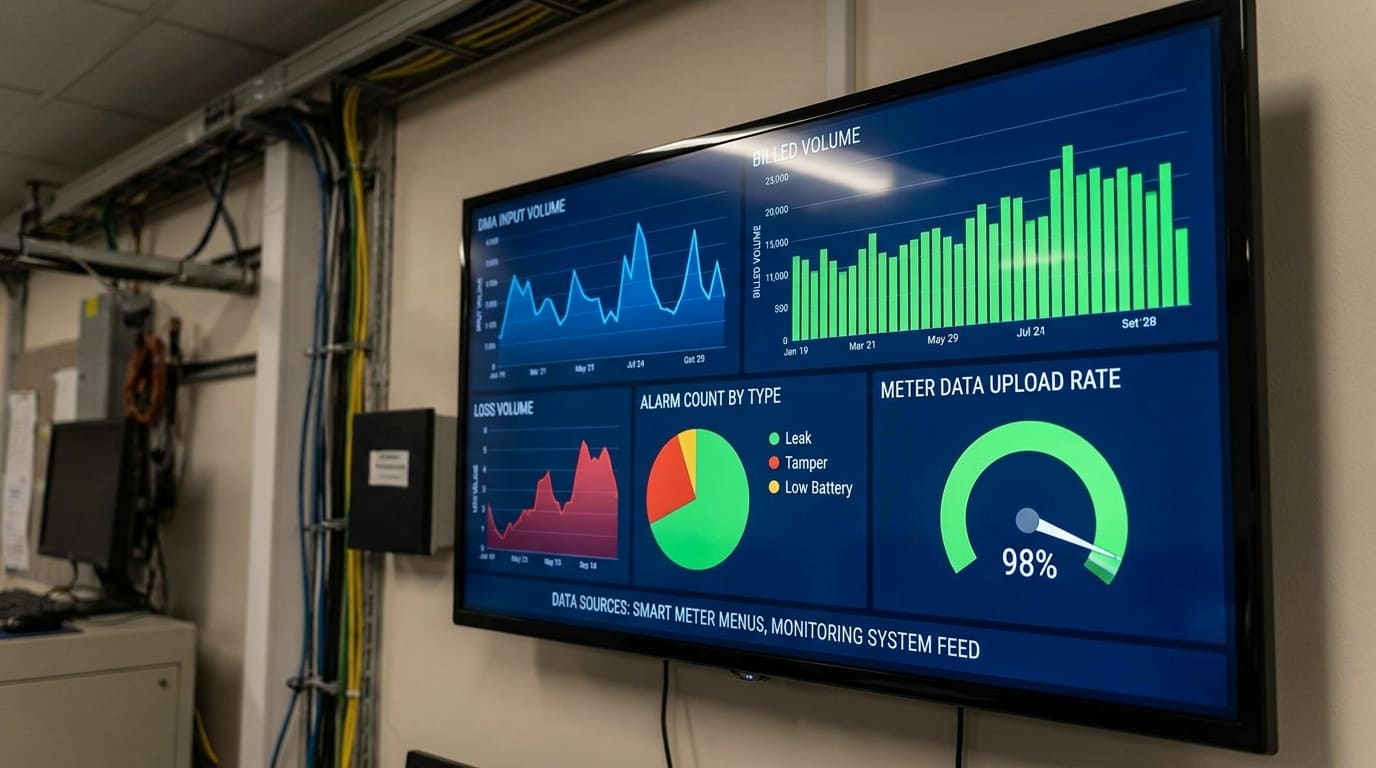
J'utilise un court framework KPI pour les projets NRW: Volume d'entrée DMA, volume facturé, volume de perte, nombre d'alarmes par type, et taux de téléchargement des données du compteur. Les menus des compteurs intelligents et le système de surveillance alimentent directement ces KPI.
Les KPI que je suis et d’où ils viennent
Je garde un KPI court pour que l'équipe l'utilise réellement. Les volumes entrants et facturés proviennent du flux cumulé (m³) sur le compteur d'entrée DMA et les sous-compteurs utilisateurs, lire dans le menu ou à distance. Le volume des pertes est simplement saisi moins facturé sur la même période. Le nombre d'alarmes par type provient du système de surveillance, qui reçoit des rapports actifs sur les fuites, éclate, erreurs de direction, et événements sans flux. Le taux de téléchargement des données du compteur est également important, parce que les données manquantes simulent une perte. Le compteur intelligent signale activement les informations anormales via le système sans fil GSM, et la version Lora peut se connecter à un concentrateur via mobile GSM ou Ethernet. Je surveille également l'état de la batterie, car une batterie faible est signalée au système avec un symbole dédié, et les rapports manqués remontent souvent à un compteur dont la batterie aurait dû être remplacée.. Des normes comme ISO 4064:2014, OIML R49-2013, et MID me donnent une référence de précision cohérente pour chaque KPI.
| KPI | Source | Pourquoi je le suis |
|---|---|---|
| Input volume | DMA inlet meter | Sommet du solde |
| Billed volume | User submeters | Bas de balance |
| Nombre d'alarmes | Système de surveillance | Cause première de NRW |
| Taux de téléchargement | Journal des communications | Fiabilité des données |
| État de la batterie | Écran LCD + rapport système | Empêche la perte de données |
Feuille de route de mise en œuvre du DMA étape par étape?
Un programme DMA échoue lorsque l'utilitaire tente de tout faire en même temps. Je déploie toujours par phases.
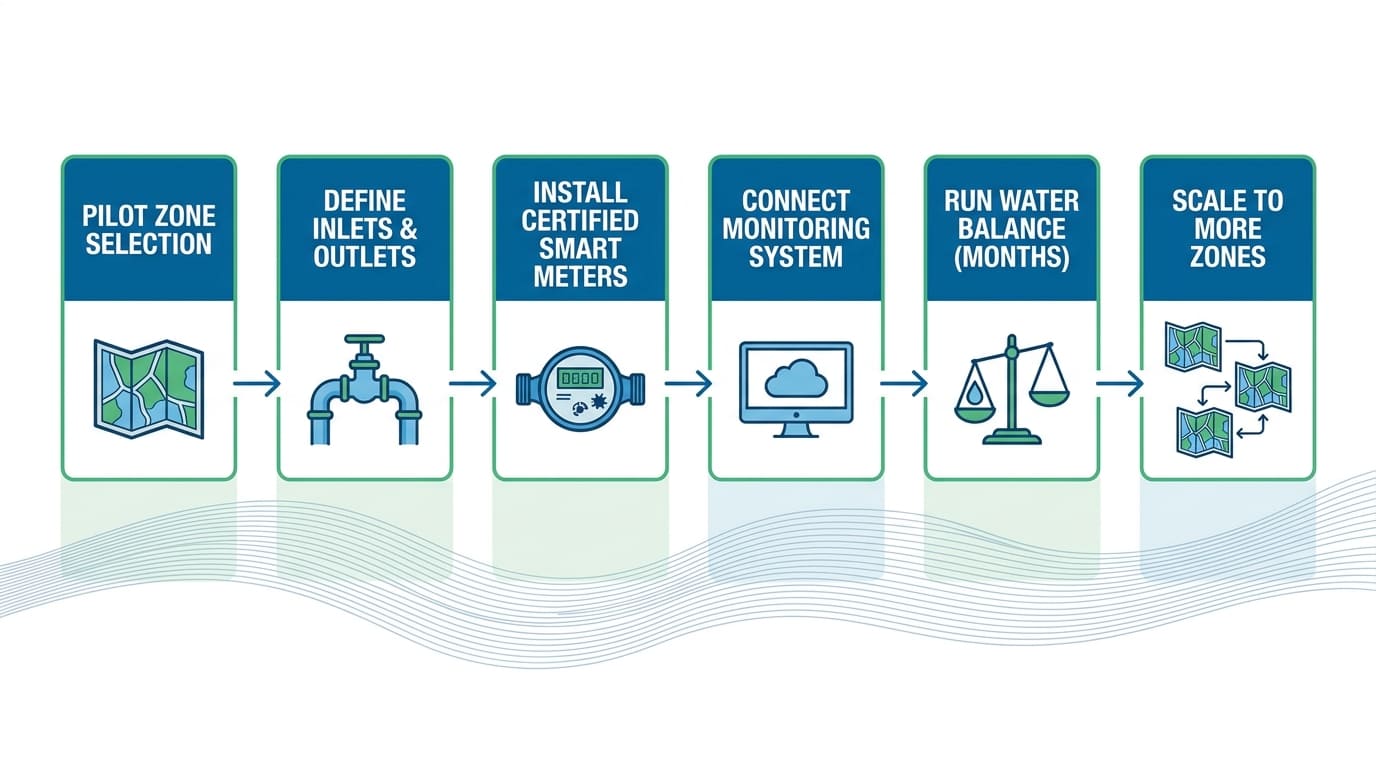
Je suis une feuille de route étape par étape: choisir une zone pilote, définir les entrées et les sorties, install certified smart meters, connect the monitoring system, run a water balance for a few months, then scale to more zones.
The Phases I Recommend
I break the roadmap into five phases. Phase one is zone selection: I pick a DMA with a clear boundary and known large users. Phase two is meter choice: I use smart ultrasonic meters that meet ISO 4064:2014, OIML R49-2013, MILIEU, et GB/T 778.1/2/3-2007 for measurement, installation, et méthodes de test. Phase three is installation, which must be strictly in accordance with the site professional engineering design, sans modification sans autorisation de l'ingénieur. Phase four is communication: I connect meters to a GSM wireless data collector or to a concentrator via LoRa, so the system forms a full wireless monitoring setup that actively reports abnormal information. Phase five is operation: I run the water balance monthly, track alarms, et agir sur chaque événement — long débit pour les fuites, grand débit pour les rafales, alarmes de direction pour altération, et sans débit pour les sections sèches. Ce n'est qu'une fois que le DMA pilote affiche des données stables que je passe à la zone suivante.
| Phase | Action principale | Référence clé |
|---|---|---|
| 1. Sélectionnez une zone | Effacer les entrées/sorties | Conception DMA |
| 2. Choisir un compteur | Compteur intelligent certifié | ISO 4064 / MILIEU |
| 3. Installer | Suivre la conception technique | Aucune modification non autorisée |
| 4. Communiquer | GSM / LoRa / Ethernet | Wireless monitoring |
| 5. Fonctionner | Solde mensuel + alarmes | Action basée sur un événement |
Conclusion
Les journaux d'événements DMA et compteurs intelligents transforment NRW d'un jeu de suspicion en un programme basé sur les données, où chaque perte a un nom, un emplacement, et une action.
À la recherche d’un fournisseur de compteurs d’eau fiable?
YOUNIO fabrique des compteurs d'eau mécaniques et ultrasoniques du DN15 au DN500, Certifié MID et testé selon ISO 4064. Échantillons gratuits et rapports de tests en usine disponibles pour les acheteurs qualifiés.