


Non-revenue water (NRW) eats utility budgets. I see managers blame meters, blame users, and blame pipes. The truth usually hides in data no one has collected yet.
I use district metering non revenue water smart solutions to turn guesses into proof. Some "low reading" complaints turn out to be illegal pipe changes or bypasses, and smart meter event logs help restore the real story.

I work with utilities that suspect theft, leaks, or meter errors but cannot prove any of them. Without a District Metered Area (DMA) and smart meters, every complaint becomes a long argument. With DMA data and event logs, the conversation shifts from emotion to evidence. In this post, I share what I learn from problem projects, how I build a water balance, how I spot illegal connections with event data, and how I roll out DMAs step by step.
What Is a District Metered Area (DMA)?
A DMA is a small, measurable slice of the network. I cut the big pipe map into sections I can actually monitor.
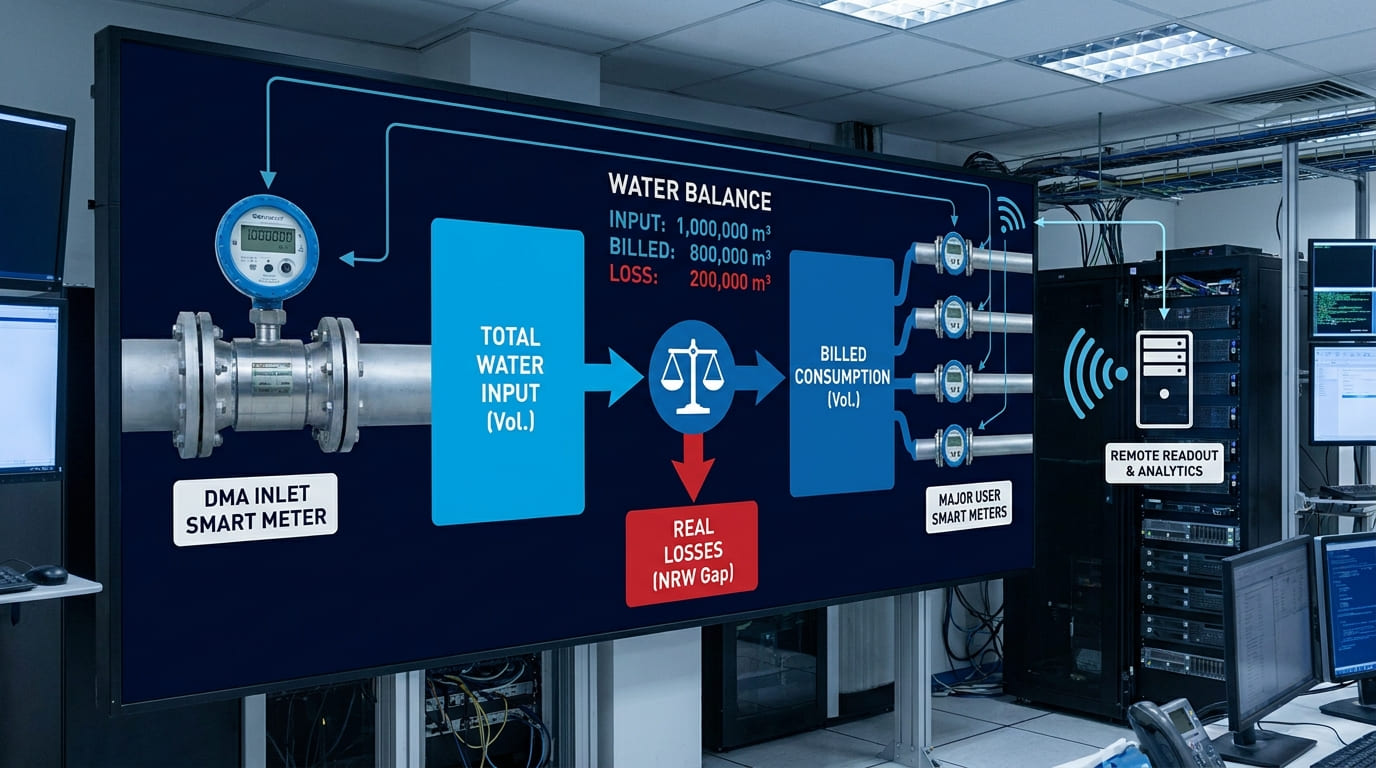
I define a DMA as a zone with known inlets and outlets, where every inflow is metered and every large user is submetered. This lets me compare input water with billed water and find the gap.

Why I Break the Network Into Zones
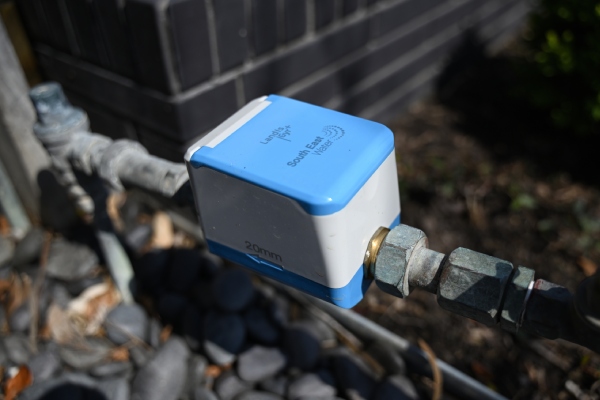
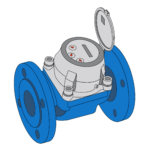
I break a network into zones because one big meter at the source tells me almost nothing. I cannot see where the loss happens. Inside a DMA, I install smart meters at the inlet and at key users, and I connect them to a monitoring system. The smart ultrasonic meter can relate to a GSM wireless data collector and use the GSM mobile public network for data transmission to form a wireless monitoring system, and when the pipeline network runs abnormally, it actively reports the abnormal information of the pipeline network. With a Lora version, the meter can also connect to a concentrator, and the wireless data collector uses GSM mobile or Ethernet network for data transmission. This zone-by-zone setup turns a blind network into a measurable one, and it is the base for every NRW action that follows.
| DMA element | What I install | Why it matters |
|---|---|---|
| Inlet | Smart bulk meter | Measures total input |
| Large users | Smart submeters | Splits known demand |
| Communication | GSM / LoRa / Ethernet | Remote monitoring |
| Alarms | Event-based reporting | Finds abnormal flow |
Building a Water Balance with Smart Meters?
A water balance is the core of any NRW program. Input minus billed use equals loss, in simple words.
I build a water balance with smart meters at the DMA inlet and at major users, and I read them remotely. The gap between input and billed volume shows real losses, not guessed ones.
How I Collect the Numbers
I collect numbers from the meter menu and from the monitoring system. On each smart meter, users can switch display screens with a magnetic rod and view instantaneous flow (m³/h), cumulative flow (m³), screen detection, table address, cumulative working time (h), date, caliber, and software version. For a DMA, I only need two groups of numbers: the inlet cumulative flow and the sum of user cumulative flows over the same period. The difference is my apparent plus real loss. For remote collection, the smart meter reports data through the GSM wireless monitoring system, which saves manual reading and gives me a consistent time base. I follow standards for the meters themselves: ISO 4064:2014, OIML R49-2013, MID, and GB/T 778.1/2/3-2007 for closed full pipelines, installation, and test methods. With one clean time base and certified meters, my balance is defensible in front of tender committees and auditors.
| Number I need | Source | How I read it |
|---|---|---|
| Input volume | DMA inlet meter | Cumulative flow (m³) |
| Billed volume | User submeters | Cumulative flow (m³) |
| Time base | System clock | Date on meter menu |
| Transmission | GSM / Ethernet | Wireless monitoring |
Typical NRW Sources Revealed by DMA Data?
Once a DMA runs, the real sources of loss show up fast. I stop arguing and start reading.
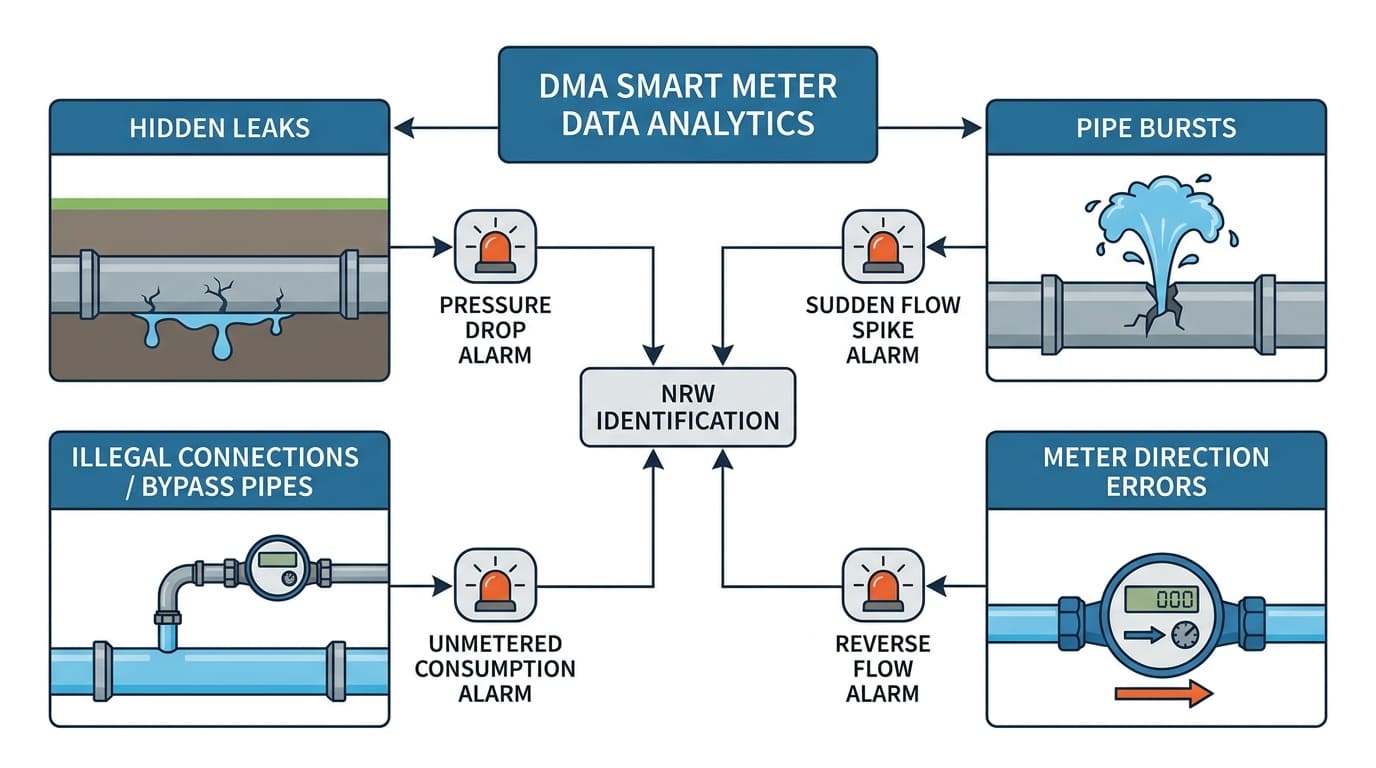
I see four common NRW sources from DMA data: hidden leaks, pipe bursts, illegal connections or bypass pipes, and meter direction errors. Smart meter alarms point to each of them.
What the Alarms Actually Tell Me
I map each alarm to an NRW source. When the flow signal shows water running for a long time, such as 24 hours, the system actively reports the error and alarms, and I treat this as a pipeline leak signal. When the flow signal shows large water flow running for a long time, with yield of water and time set by the operator, the system reports and stores the error and alarms, and I treat this as a pipeline burst. When the water meter is installed in the wrong direction, the system actively reports and stores the error and alarms, which often exposes unauthorized pipe changes on the user side. When there is no water in the pipeline and no signal in the transducer, the system reports, stores, and alarms too, which helps me catch dry sections or closed valves. Each alarm turns an abstract NRW number into a concrete field ticket.
| NRW source | Alarm used | Typical root cause |
|---|---|---|
| Hidden leak | Long-flow alarm (24h) | Buried pipe crack |
| Burst | Large-flow alarm | Main break |
| Illegal connection | Direction alarm | Reversed or bypass pipe |
| Closed/empty section | No-flow alarm | Valve or dry line |
Looking for a Reliable Water Meter Supplier?
YOUNIO manufactures mechanical and ultrasonic water meters from DN15 to DN500, MID-certified and tested to ISO 4064. Free samples and factory test reports available for qualified buyers.
Case Studies: From Suspicion to Data-Driven Proof?
I have seen projects where staff suspected theft for years. Without data, they could not act. With DMA and smart meters, the truth came out in weeks.
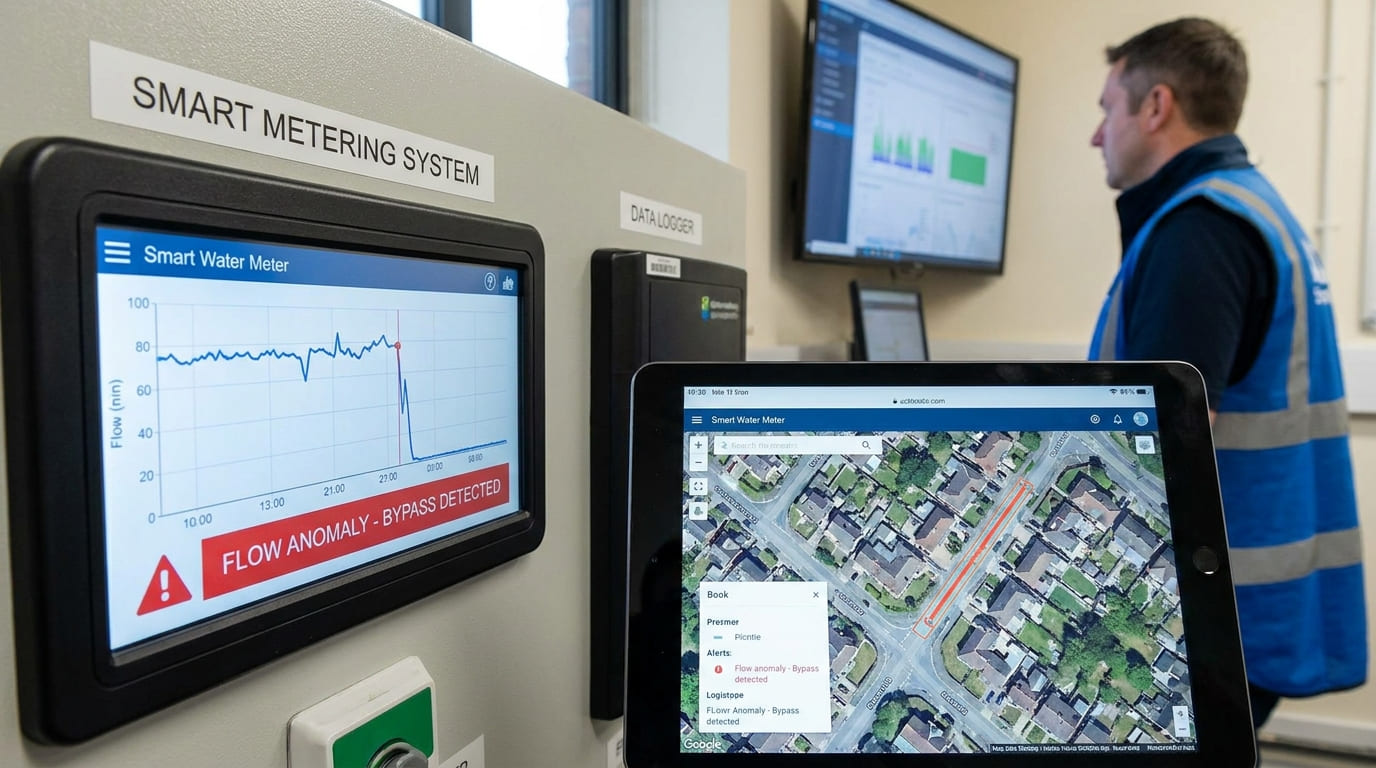
I use case patterns where "low reading" complaints looked like meter failures but turned out to be illegal pipe changes or bypasses. Smart meter event logs restored the real story and protected the utility’s reputation.
Patterns I Meet Again and Again
I describe three patterns I meet in problem projects. In the first, a user complained that the meter read too low after a new install. Field check showed the meter direction alarm had triggered, meaning the meter was installed in the wrong direction, which can happen after unauthorized pipe work. In the second, a DMA showed a stable night flow that did not drop to near zero. The long-flow alarm at a specific submeter pointed to a buried leak after 24 hours of continuous flow. In the third, a large user’s cumulative flow looked normal, but the DMA balance still showed big losses. By reading each smart meter’s menu — instantaneous flow, cumulative flow, working time, and date — I found one meter with almost no working time, which hinted at a bypass pipe feeding unmetered water. In each case, I moved from suspicion to proof because the meter stored and reported events actively.
| Suspicion | Data that proved it | Action |
|---|---|---|
| Meter too low | Direction alarm | Reinstall, audit pipe |
| Hidden waste | Long-flow alarm | Find and repair leak |
| Bypass pipe | Low working time on meter | Inspect user premises |
Using Events and Alarms to Spot Illegal Connections?
Illegal connections and bypasses are the hardest NRW source to confront. I need data that a user cannot argue with.
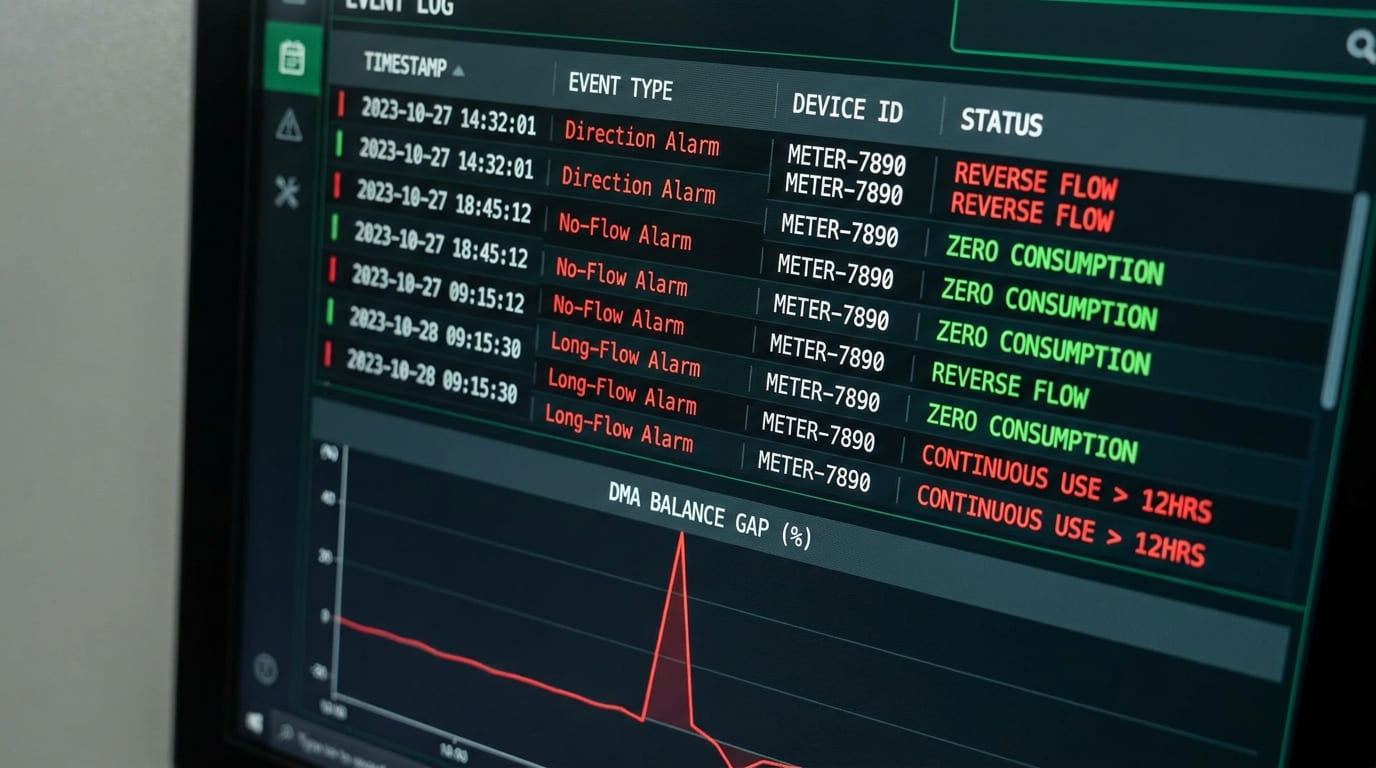
I use smart meter events — direction alarms, no-flow alarms, long-flow alarms — plus DMA balance gaps to point to illegal connections. Stored event logs give me a timeline that holds up in a dispute.
How I Build an Evidence Chain
I build an evidence chain from three layers. The first layer is the meter itself. The smart ultrasonic meter actively reports abnormal information of the pipeline network to the monitoring system, and battery status is also visible: when the battery is low, the LCD displays a low-battery symbol and reports the information to the management system. The second layer is event type. Flow direction detection reports a reversed-direction event, which is a strong sign of tampering or bypass. Flow detection reports no-signal events, which helps me check if someone closed a valve and opened an unmetered path. Pipeline leak detection and burst detection add context around the time window. The third layer is DMA balance. If the inlet volume does not match the sum of user volumes, and a user has a direction alarm at the same time, I have aligned evidence. Because installation must follow the site professional engineering design and alteration without engineer permission is strictly prohibited, any unauthorized change becomes a clear contract breach.
| Evidence layer | Data point | Why it matters |
|---|---|---|
| Meter | Active abnormal report | Real-time signal |
| Event | Direction / no-flow alarm | Tampering indicator |
| Balance | DMA inlet vs. sum of users | Quantifies gap |
| Rule | Engineering design compliance | Legal basis |
KPI Framework for NRW Projects?
Without KPIs, an NRW project drifts. I set a small set of numbers and track them every month.
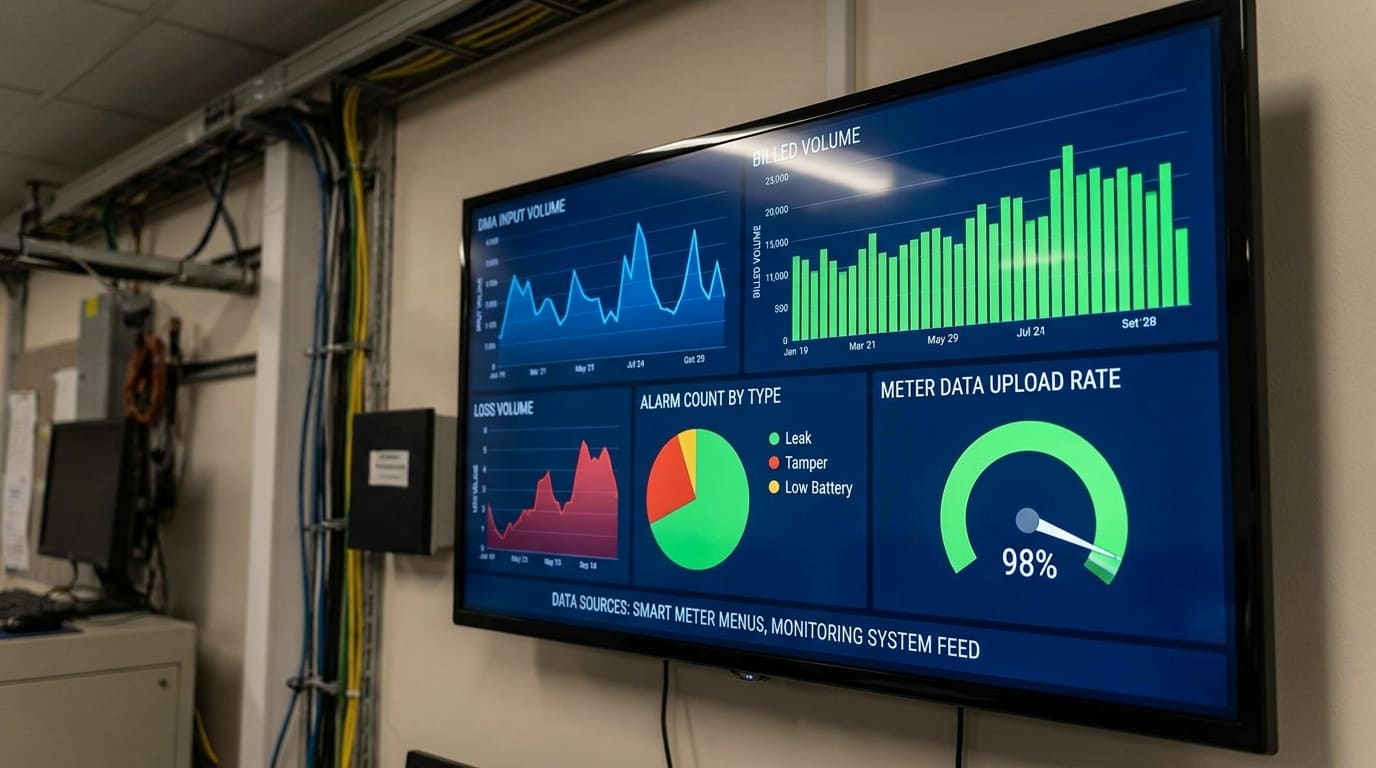
I use a short KPI framework for NRW projects: DMA input volume, billed volume, loss volume, alarm count by type, and meter data upload rate. Smart meter menus and the monitoring system feed these KPIs directly.
The KPIs I Track and Where They Come From
I keep the KPI set short so the team actually uses it. Input and billed volumes come from cumulative flow (m³) on the DMA inlet meter and the user submeters, read through the menu or remotely. Loss volume is simply input minus billed over the same period. Alarm count by type comes from the monitoring system, which receives active reports for leaks, bursts, direction errors, and no-flow events. Meter data upload rate matters too, because missing data fakes a loss. The smart meter reports abnormal information actively through the GSM wireless system, and the Lora version can connect to a concentrator via GSM mobile or Ethernet. I also track battery health, since low battery is reported to the system with a dedicated symbol, and missed reports often trace back to a meter that should have had its battery replaced. Standards like ISO 4064:2014, OIML R49-2013, and MID give me a consistent accuracy reference for every KPI.
| KPI | Source | Why I track it |
|---|---|---|
| Input volume | DMA inlet meter | Top of balance |
| Billed volume | User submeters | Bottom of balance |
| Alarm count | Monitoring system | NRW root cause |
| Upload rate | Communication log | Data reliability |
| Battery status | LCD + system report | Prevents data loss |
Step-by-Step DMA Implementation Roadmap?
A DMA program fails when the utility tries to do everything at once. I always roll out in phases.
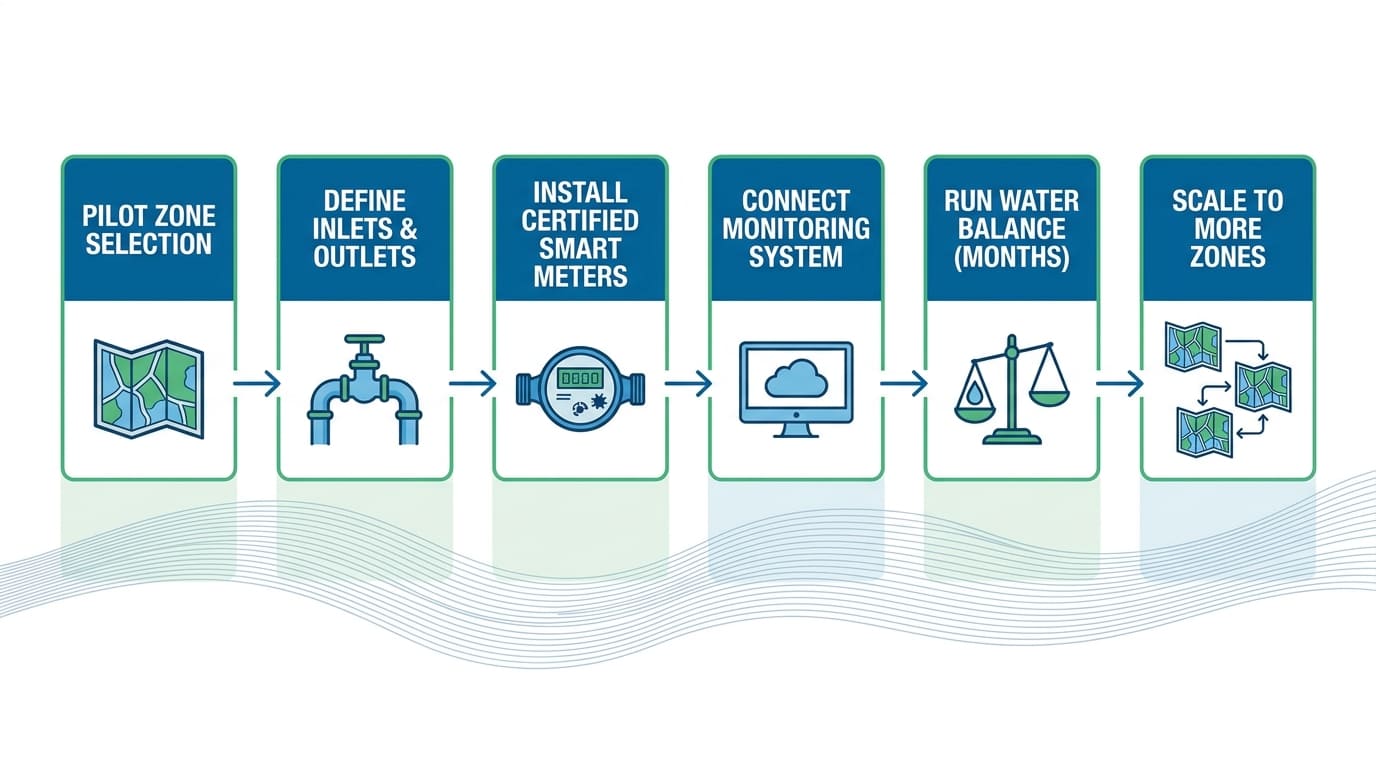
I follow a step-by-step roadmap: pick a pilot zone, define inlets and outlets, install certified smart meters, connect the monitoring system, run a water balance for a few months, then scale to more zones.
The Phases I Recommend
I break the roadmap into five phases. Phase one is zone selection: I pick a DMA with a clear boundary and known large users. Phase two is meter choice: I use smart ultrasonic meters that meet ISO 4064:2014, OIML R49-2013, MID, and GB/T 778.1/2/3-2007 for measurement, installation, and test methods. Phase three is installation, which must be strictly in accordance with the site professional engineering design, with no alteration without engineer permission. Phase four is communication: I connect meters to a GSM wireless data collector or to a concentrator via LoRa, so the system forms a full wireless monitoring setup that actively reports abnormal information. Phase five is operation: I run the water balance monthly, track alarms, and act on each event — long-flow for leaks, large-flow for bursts, direction alarms for tampering, and no-flow for dry sections. Only after the pilot DMA shows stable data do I scale to the next zone.
| Phase | Main action | Key reference |
|---|---|---|
| 1. Select zone | Clear inlets/outlets | DMA design |
| 2. Choose meter | Certified smart meter | ISO 4064 / MID |
| 3. Install | Follow engineering design | No unauthorized change |
| 4. Communicate | GSM / LoRa / Ethernet | Wireless monitoring |
| 5. Operate | Monthly balance + alarms | Event-based action |
Conclusion
DMA plus smart meter event logs turn NRW from a suspicion game into a data-driven program, where every loss has a name, a location, and an action.
Looking for a Reliable Water Meter Supplier?
YOUNIO manufactures mechanical and ultrasonic water meters from DN15 to DN500, MID-certified and tested to ISO 4064. Free samples and factory test reports available for qualified buyers.