



Traditional meter complaints arrive late. Smart city utilities see problems earlier, but only if data, teams, and field response work together.
Smart city water metering solutions combine accurate meters, AMI communication, 클라우드 플랫폼, 경보 규칙, billing integration, and field workflows. The main change is not only remote reading. It is better visibility across NRW, 고객 불만, engineering decisions, and billing data.
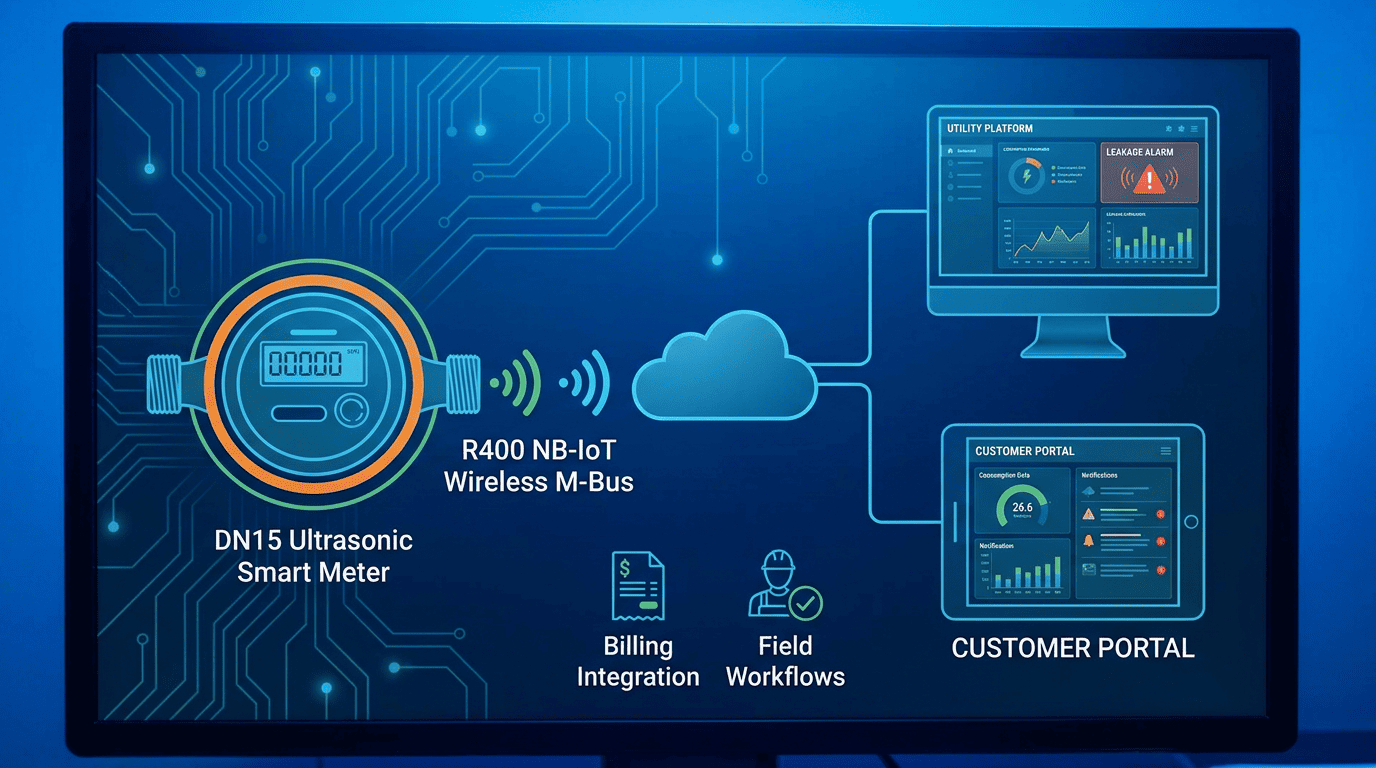
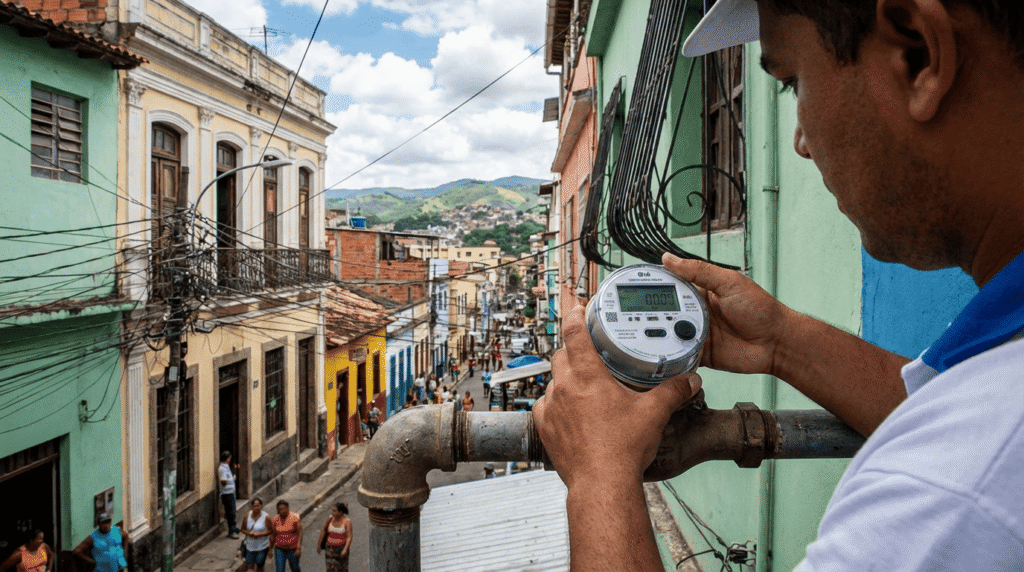
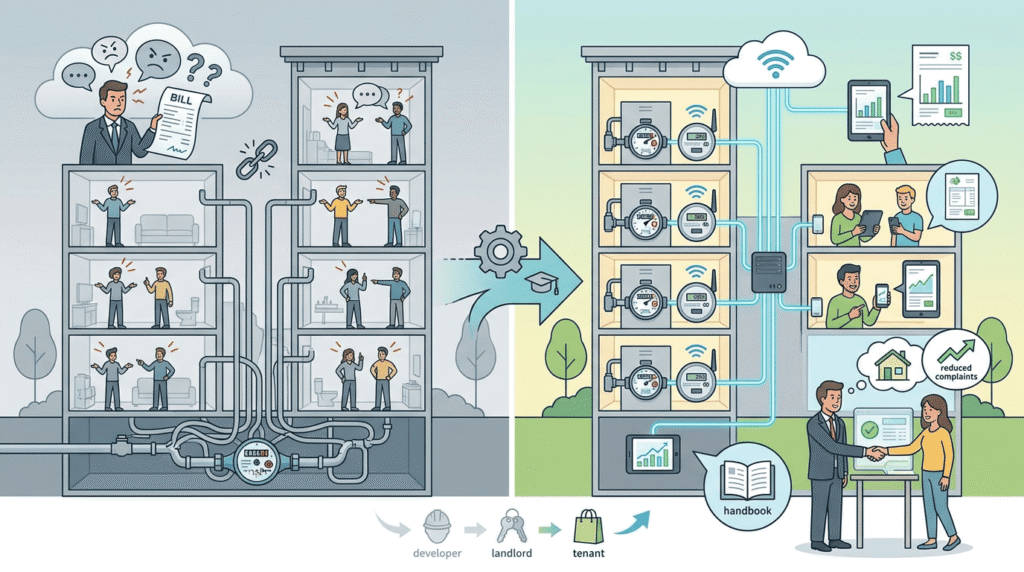
I see this difference clearly in global projects. Traditional utilities often receive complaints after the customer notices a bill problem. Smart city utilities receive alarms, upload logs, consumption curves, and field data before the complaint becomes a dispute.
The Role of Water Metering in Smart Cities?
A smart city cannot manage invisible water. If the meter fleet is blind, NRW, 청구, and complaints stay reactive.
Water metering in a smart city provides verified consumption data, event records, 원격 독서, and alarm inputs. It supports NRW reduction, billing quality, 고객 서비스, and engineering decisions, but it does not replace field repair or network management.
Why I Treat the Meter as a Data Node
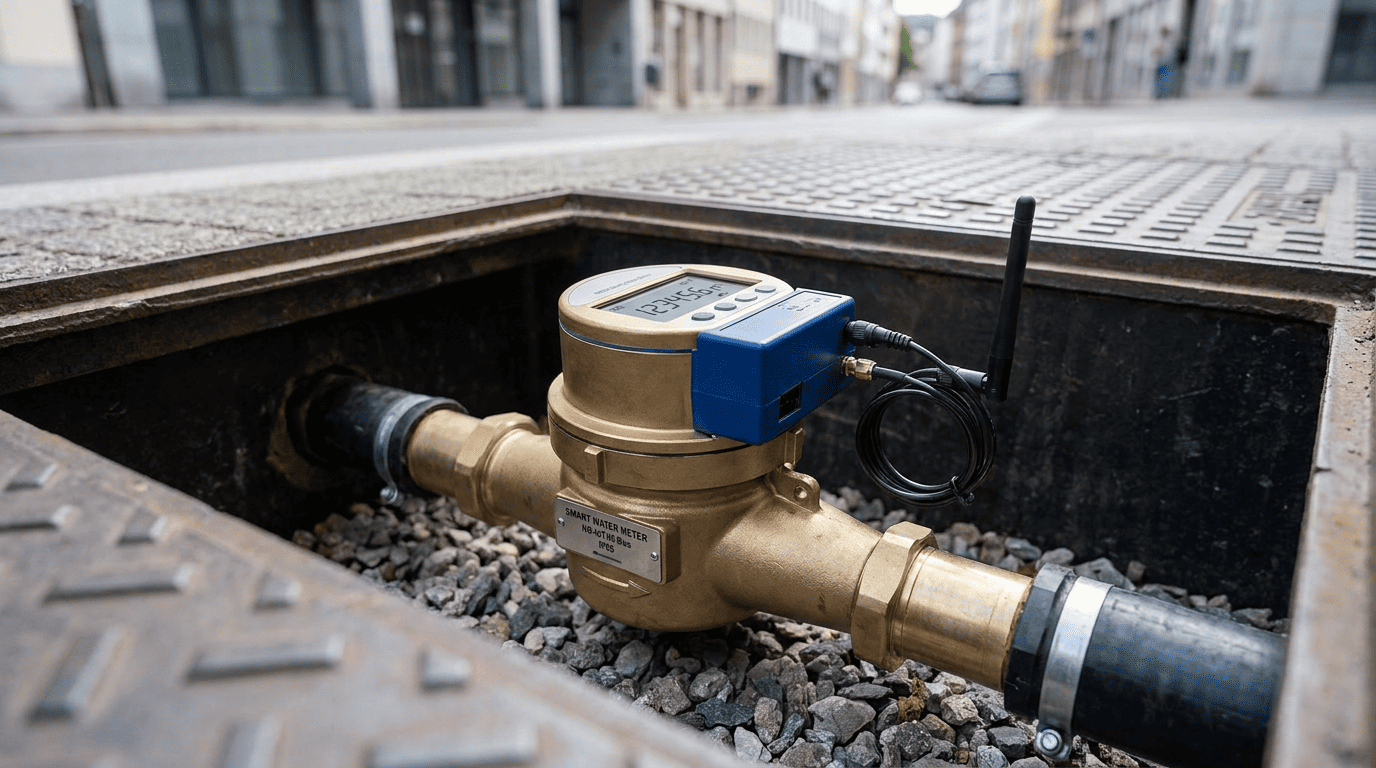
I do not treat a smart water meter as only a billing device. In a smart city project, I treat it as a data node in the water system. It measures consumption, stores events, shows local information, and sends scheduled data to a platform when the communication system is prepared correctly.
A residential ultrasonic smart meter can support this role because it uses static ultrasonic measurement technology and can be integrated with IoT technologies for intelligent utilities and smart city applications. Some smart ultrasonic meters also support leakage detection, 마른 파이프 감지, bidirectional flow measurement, 알람 디스플레이, 무선 M-Bus 및 NB-IoT와 같은 통신 옵션.
But I stay conservative. A meter can support earlier warning. It cannot repair a pipe leak. It can record reverse flow if the function is supported. It cannot stop all tampering. It can improve data transparency. It cannot clean wrong customer master data by itself.
| Smart City Need | Meter Contribution | What the Utility Still Must Do |
|---|---|---|
| NRW visibility | consumption data and alarms | district analysis and field repair |
| Billing quality | scheduled readings | billing system validation |
| Complaint reduction | event records and logs | customer service workflow |
| Data transparency | cloud and portal data | data governance and access rules |
| Engineering planning | consumption and abnormal trends | pressure and network response |
For low-flow capture, I always separate starting flow rate from Q1. A referenced ultrasonic meter has a stated ultralow starting flow down to 0.001 m³/시간. Starting flow means the point where the meter begins to register volume. Q1 means the lowest flow within the declared metrological accuracy range. These are not the same.
If a DN15 residential example has Q3 = 2.5 m³/h and R = 400, then:
| 매개변수 | Example Value |
|---|---|
| Meter size | DN15 |
| 3분기 | 2.5 m³/시간 |
| R 값 | 400 |
| Formula | Q1 = Q3 ÷ 아르 자형 |
| 1분기 | 2.5 ÷ 400 = 0.00625 m³/h = 6.25 L/h |
This example is a calculation assumption, not a universal value. I would verify the final Q3, 아르 자형, 1분기, and starting flow from the selected product datasheet before tender approval.
From Manual Reading to AMI and Beyond?
Manual reading hides problems between visits. AMI makes the data visible, but visibility only helps when the utility acts on it.
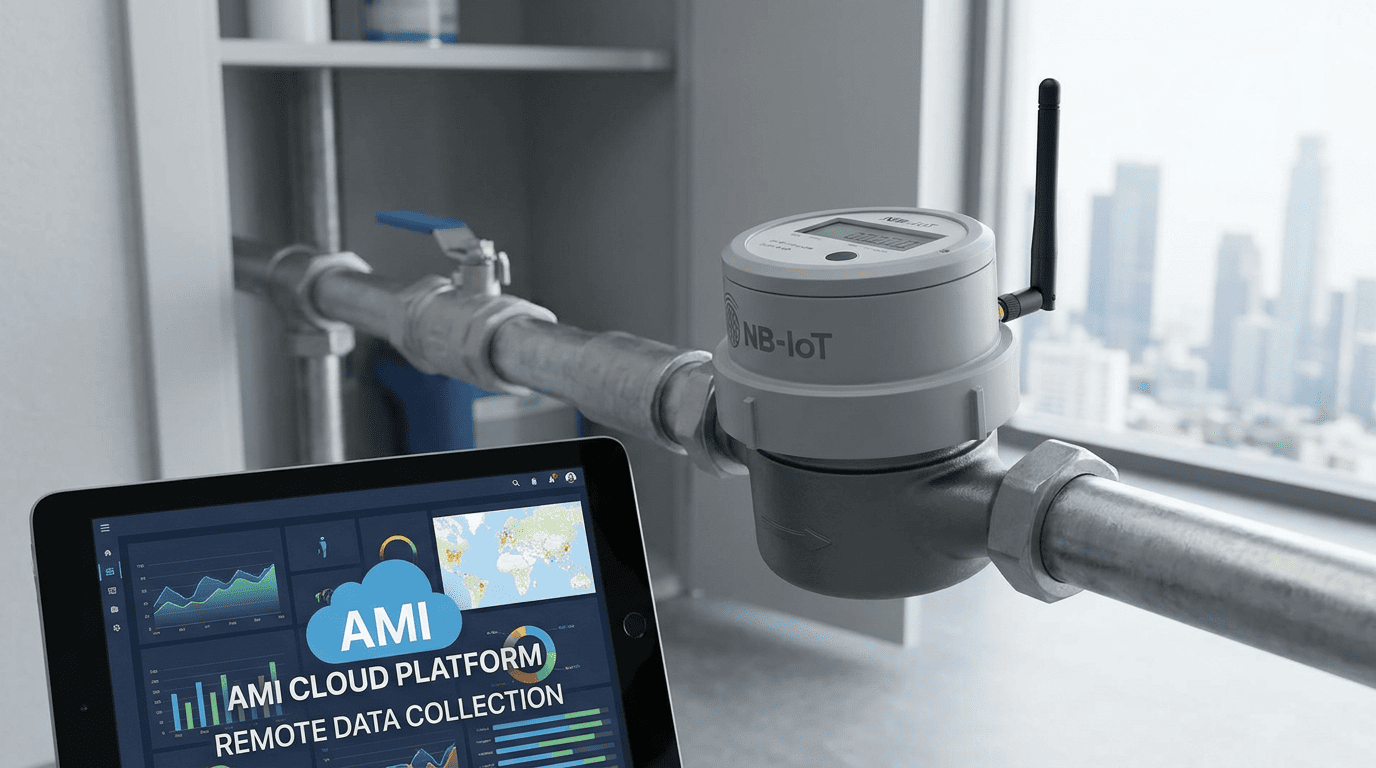
AMI moves utilities from periodic manual reading to scheduled remote data collection, alarm review, communication logs, and platform-based workflows. 미터, network, 플랫폼, and billing system must work as one project system.
What Changes After AMI Deployment
In manual reading, the utility often knows a problem only after the next reading cycle. If a customer has a leak, a stuck meter, a reverse flow event, or a dry pipe condition, the issue may remain invisible for weeks or months. AMI와 함께, the utility can receive scheduled readings and alarm information, depending on the meter configuration and network.
I do not say AMI gives real-time data unless the reporting cycle truly supports it. Many projects use daily uploads, hourly uploads, or event-based alarms. The reporting cycle affects battery life, network cost, and platform data volume. In the YOUNIO NB-IoT system manual, the installer can set the initial reading and upload period, and the cloud platform records those setting records. This shows why configuration control matters.
I also check communication before accepting the installation. The NB-IoT manual includes a mobile CRM process to verify meters, test NB-IoT signal, and check device online logs. It also notes that signal testing may take about one minute. This is a practical detail. If signal testing is skipped, the project may later receive “no reading” complaints that are actually network or setup issues.
| Stage | Traditional Reading | AMI Practice |
|---|---|---|
| 독서 | manual visit | scheduled upload |
| Error discovery | after customer complaint | alarm or missing-data review |
| Installation check | visual confirmation | signal test and device log |
| 청구 | manual input or batch import | platform-to-billing integration |
| Complaint evidence | photo or handwritten record | reading history and event log |
AMI also changes team responsibility. The metering team still cares about accuracy. IT cares about device IDs, cloud records, cybersecurity, and platform stability. Billing cares about customer account matching. Field crews care about installation and signal. If one team works alone, the project becomes fragile.
How Data Changes NRW and Complaint Patterns?
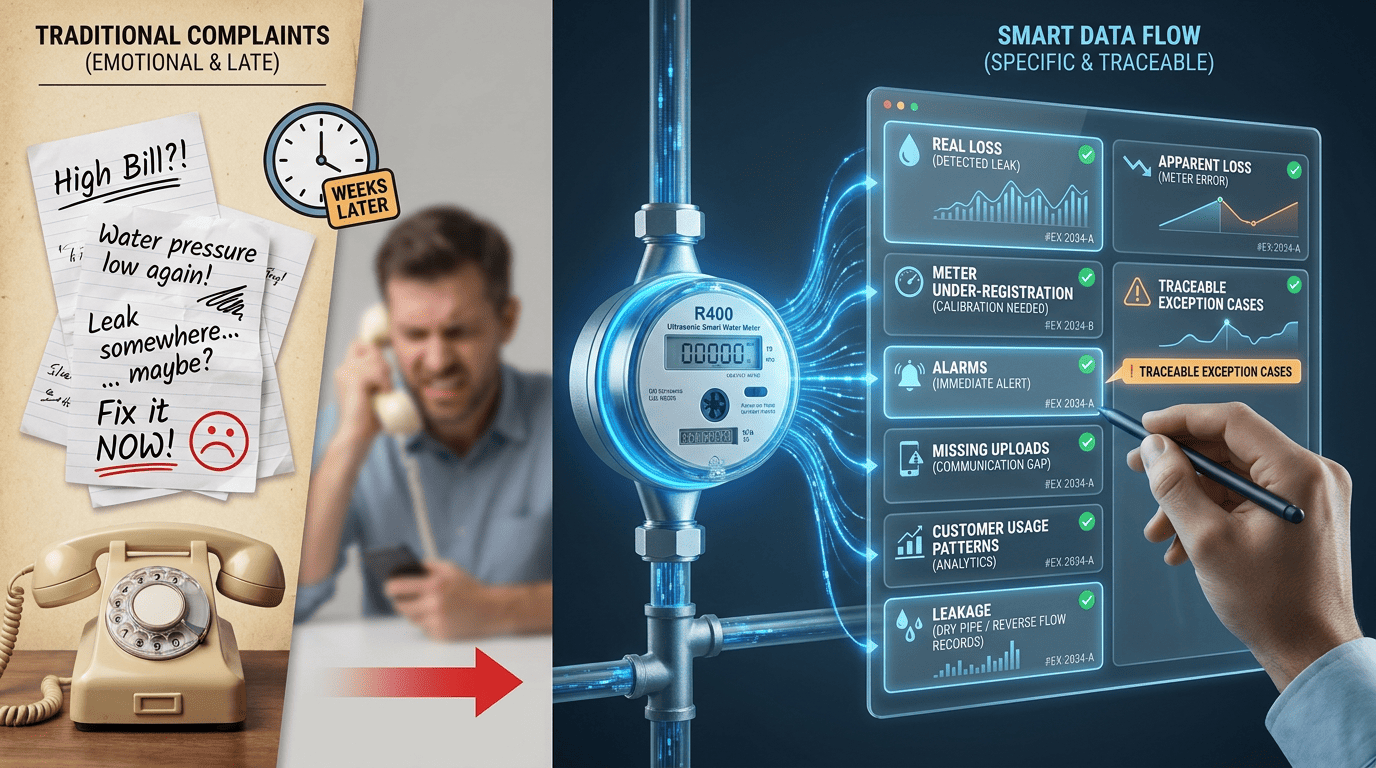
Traditional NRW complaints are often emotional and late. Smart city data makes them more specific, but also exposes more operational gaps.
Data changes NRW work by separating real loss, apparent loss, 미터 미등록, 경보, missing uploads, and customer usage patterns. Smart utilities receive fewer vague complaints and more traceable exception cases.
Why Smart Utilities See Different Complaints
In traditional utilities, a customer may complain only when the bill is too high, too low, or missing. The utility then checks the meter, reading record, and sometimes the pipe. The complaint is broad. It may be called “meter problem” even when the root cause is leakage, wrong account data, illegal connection, estimated billing, 아니면 설치가 잘 안됐거나.
In smart city projects, the complaint structure changes. I see more specific cases. The customer may ask why the portal shows night flow. Billing may ask why one meter has no upload for three days. Engineering may ask why a district has rising minimum night flow. IT may ask why a device has abnormal logs. These are not the same complaints. They are data-driven exceptions.
Smart ultrasonic meters may support leakage detection, 마른 파이프 감지, bidirectional flow measurement, reverse flow alarm display, and wireless communication. These functions help the utility find abnormal events earlier. But they do not remove the need for field confirmation. A leakage alarm may indicate continuous flow, but the utility still needs to check customer plumbing, service pipe conditions, or platform alarm rules.
| Traditional Complaint | Smart City Complaint |
|---|---|
| “My bill is wrong.” | “Why did night flow continue for 12 시간?” |
| “The meter does not work.” | “The meter has not uploaded since installation.” |
| “The reading is too high.” | “The portal shows a leakage alarm.” |
| “The meter was read wrongly.” | “The device log and billing record do not match.” |
| “The meter runs backward.” | “Reverse flow alarm needs field verification.” |
For NRW, I do not treat the meter as the only solution. NRW includes real leakage, apparent loss, 미터 미등록, illegal connections, billing errors, customer database errors, and delayed repair. Smart city water metering solutions can support NRW reduction by improving low-flow capture, remote data collection, 경보, and district visibility. The meter supports the work, but it does not replace pressure management, leak repair, illegal connection control, or data cleaning.
Cross-Department Collaboration (Engineering, 그것, 청구)?
A smart meter project fails when departments work in separate rooms. Data crosses teams, so the project must cross teams too.
Smart city metering requires engineering, 그것, 청구, 고객 서비스, and field teams to share device data, installation records, 경보 규칙, billing logic, and complaint workflows. AMI is an operating model, not only a meter purchase.
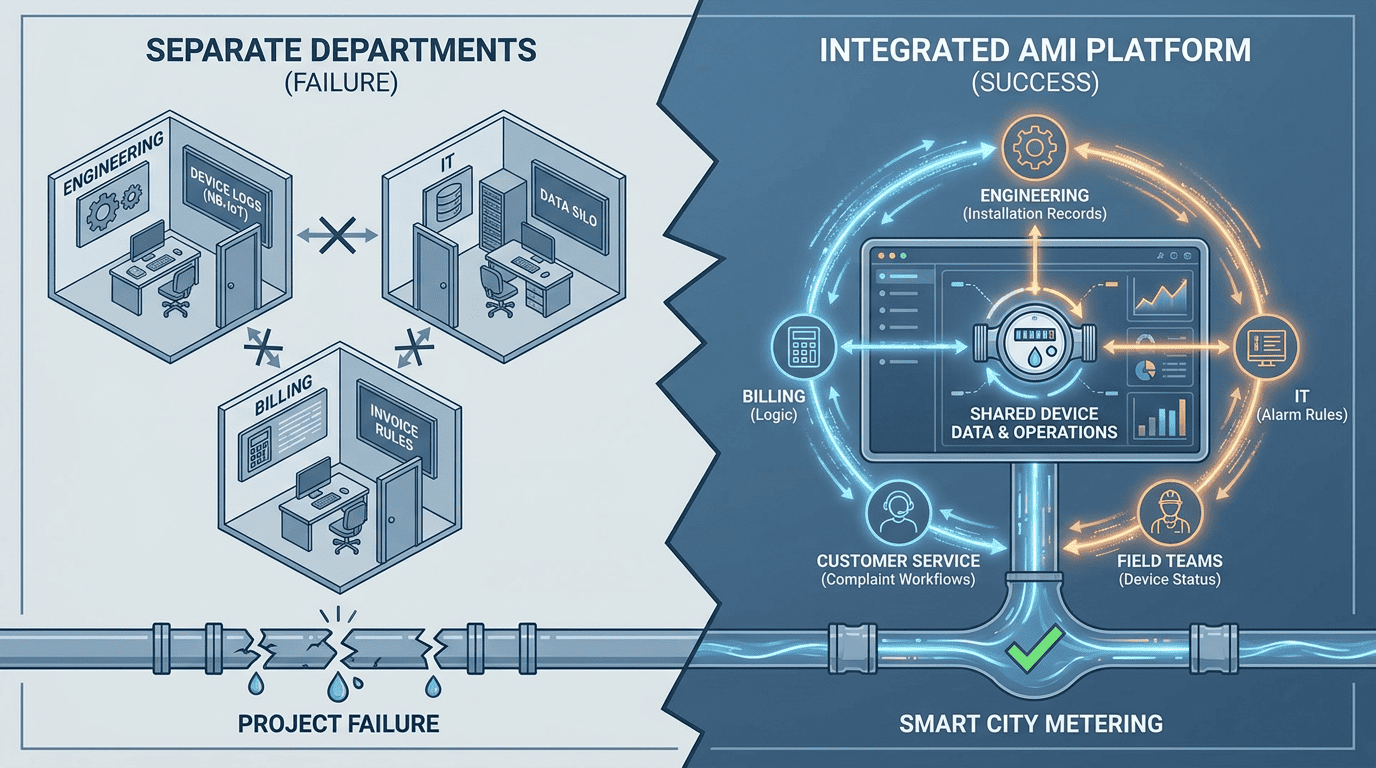
The Departments Must Share One Version of the Truth
I usually ask one simple question during AMI planning: who owns the data after the meter uploads? If the answer is unclear, the project is not ready.
Engineering may want pressure-related data, consumption trends, district imbalance, and leakage signals. Some ultrasonic smart meters can optionally integrate pressure detection, depending on configuration. IT wants device security, server access, API stability, database backup, and communication status. Billing wants validated readings, account matching, tariff logic, and exception handling. Customer service wants clear explanations for users.
The NB-IoT installation workflow shows why this collaboration matters. The installer may use a mobile CRM app to verify the water meter, test signal, check online logs, set initial reading, and set upload period. If the installer sets the wrong initial reading, billing receives bad data. If IT does not confirm device logs, billing may see missing readings. If the cloud platform records setting changes, then the utility needs rules for who can change parameters and how those changes are audited.
| Department | Main Concern | Data Needed |
|---|---|---|
| Engineering | NRW, 누출, 압력, field response | 경보, district data, 설치 조건 |
| 그것 | connectivity and platform stability | 신호, logs, device IDs, cybersecurity |
| 청구 | correct invoicing | validated reads, account link, change records |
| Customer service | complaint explanation | consumption curve, event history |
| Procurement | long-term project risk | specifications, 인증서, 테스트 보고서 |
I prefer to define a shared complaint workflow before deployment. 예를 들어, a “high bill” complaint should trigger consumption curve review, alarm review, meter data check, billing account check, and field inspection if needed. A “no reading” complaint should trigger signal log review before replacing the meter. This avoids unnecessary replacement and helps the utility identify whether the issue is metrology, 의사소통, 플랫폼, or customer data.
사례 연구: Cities That Made the Leap?
Cities do not leap because they buy smart meters. They improve because they change how data moves and who uses it.
Utilities that move successfully from manual reading to smart city metering usually start with pilots, verify communication, classify complaints, connect billing, and build cross-department response rules before full rollout.
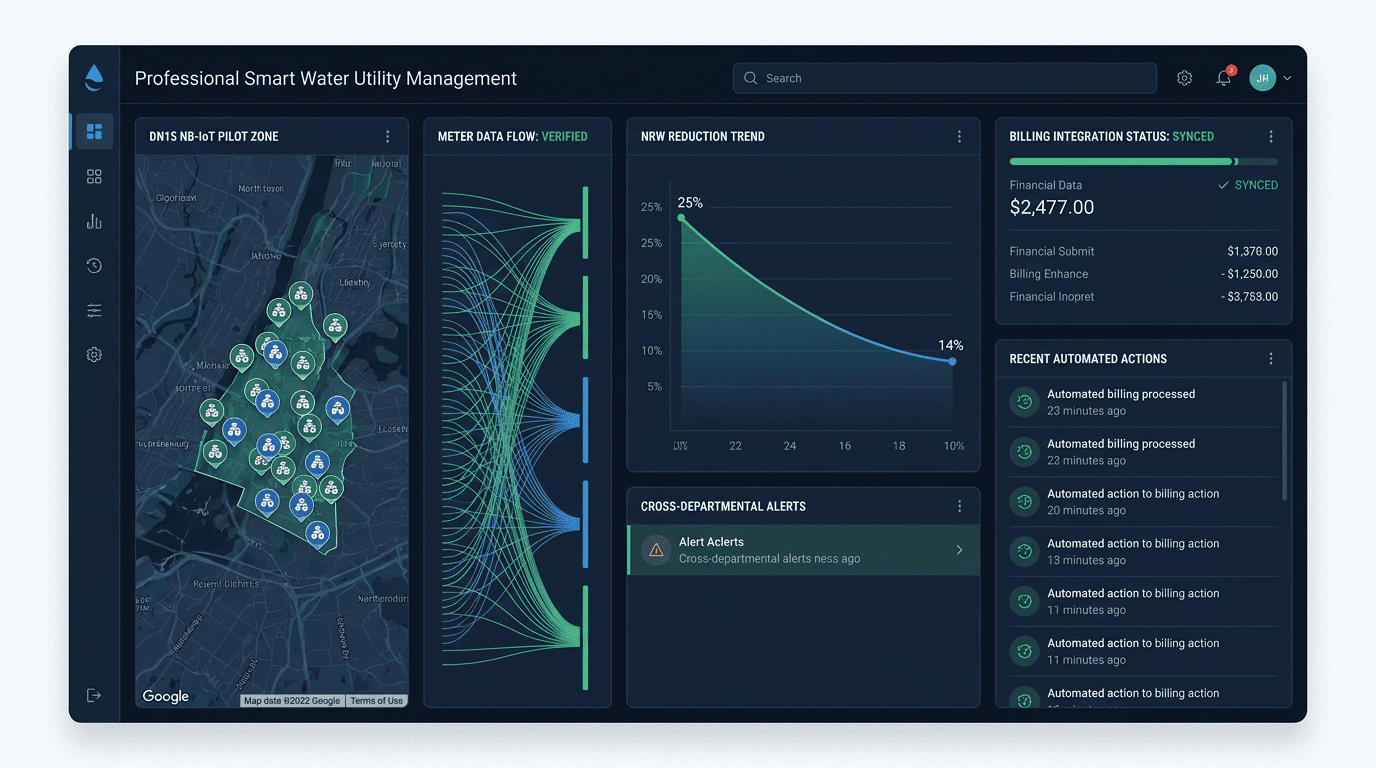
What I See in Successful Projects
I will describe these as field patterns rather than confidential customer names. The first pattern is the pilot-first utility. This utility does not install 100,000 meters immediately. It selects several zones with different buildings, 수압, customer types, and signal conditions. The team tests meter reading, 신호, device logs, upload period, billing import, and customer complaint handling. This is more reliable than assuming one result applies everywhere.
The second pattern is the data-transparent utility. This utility allows engineering, 그것, 청구, and customer service to see the same meter status. When a customer complains, the team checks reading history, alarm status, online logs, and billing records. The NB-IoT system manual supports this type of operation because it includes device log checking and cloud-recorded setting changes.
The third pattern is the NRW-focused utility. It does not expect meters to eliminate NRW. It uses smart meters to support district analysis, night-flow checks, low-flow capture, leakage alarms, and faster field response. A smart ultrasonic meter with leakage detection, 마른 파이프 감지, bidirectional flow, and IoT communication can provide useful input for this workflow.
| Successful Utility Behavior | Practical Result |
|---|---|
| Starts with pilot zones | Finds signal and installation issues early |
| Verifies upload period | Balances data needs and battery life |
| Connects billing carefully | Reduces account and reading disputes |
| Shares data across teams | Speeds complaint diagnosis |
| Classifies complaints | Shows which issue is metering, network, or billing |
| Uses field response rules | Turns alarms into action |
The fourth pattern is the lifecycle-minded utility. It tracks design changes, firmware versions, 배터리 상태, alarm categories, and complaint curves. This helps the utility decide when to adjust specifications. If a specific complaint type drops after a design or process improvement, the utility keeps that requirement in future tenders.
These utilities are not buying “more technology” for its own sake. They are changing the operating model around data.
Architecture: IoT, Cloud and Customer Portals?
A smart meter without architecture is only an electronic meter. The system must move data safely from field to decision.
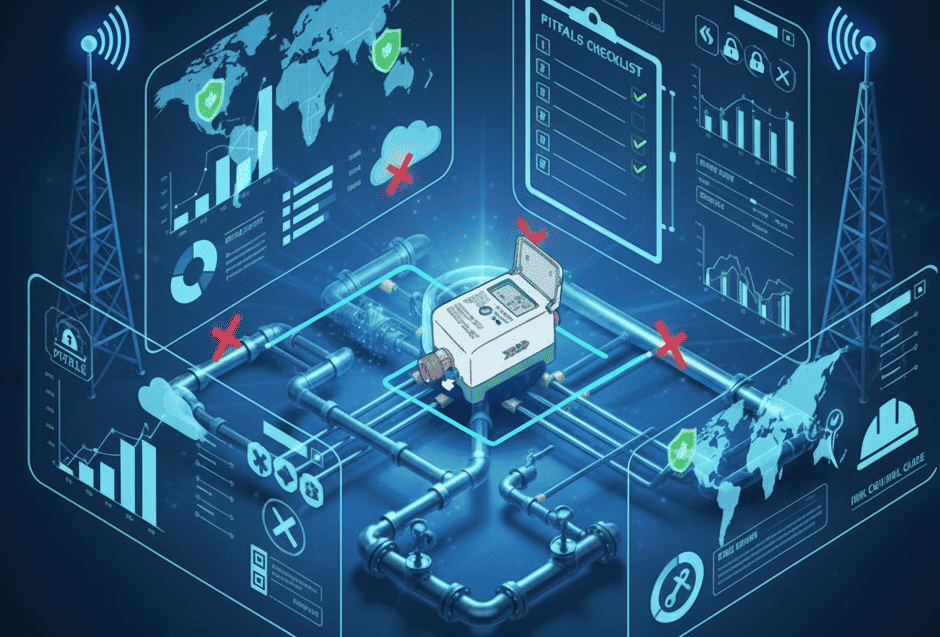
A smart city metering architecture includes meter hardware, 통신 모듈, network or gateway, head-end system, cloud platform, billing interface, customer portal, 경보 규칙, and field service workflow.
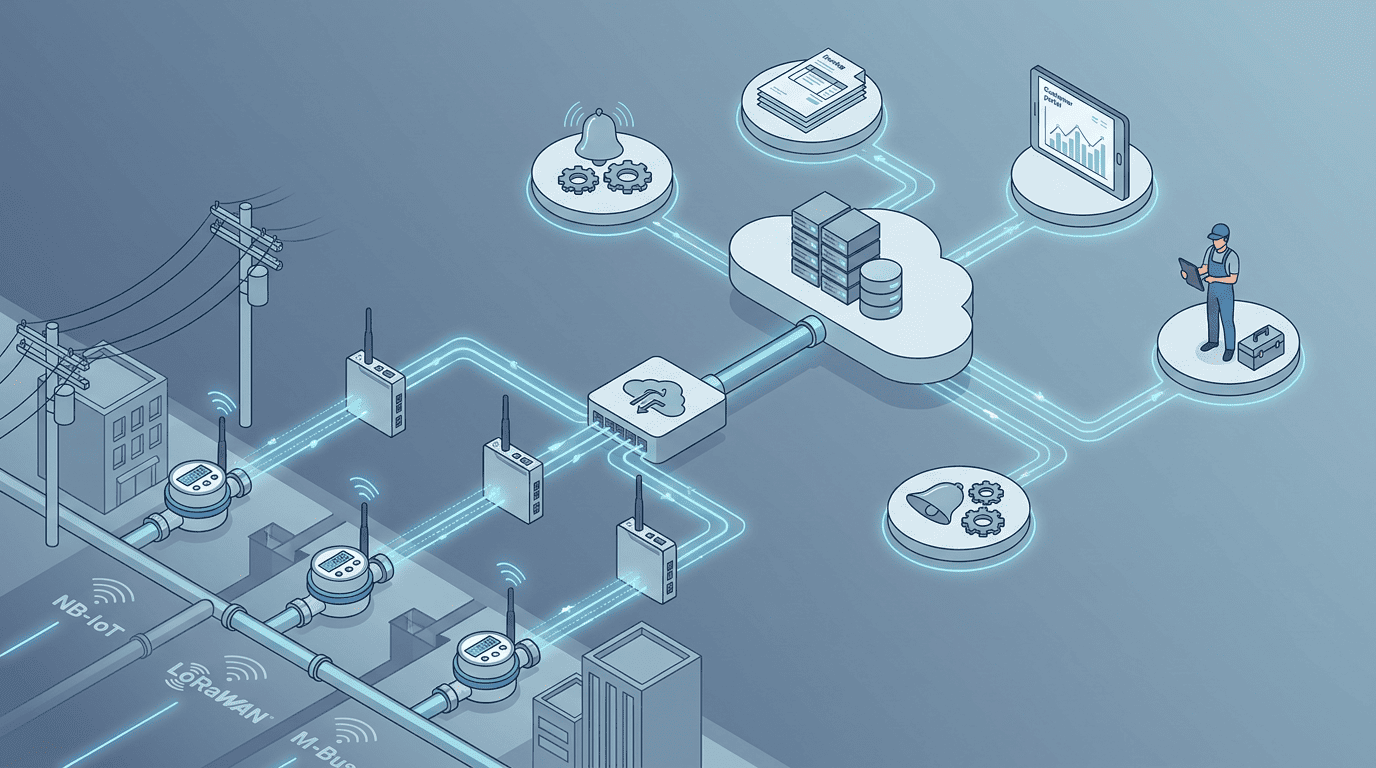
How I Map the System
I draw the architecture before I approve the meter list. The meter is only the first layer. It may include the measuring body, electronic module, 배터리, 표시하다, memory, 경보, valve if required, 및 통신 모듈. The referenced ultrasonic smart meter supports communication technologies such as wireless M-Bus and NB-IoT. That gives options, but the project must choose the option that fits local coverage, 비용, and platform needs.
NB-IoT용, the meter usually depends on operator coverage, SIM or telecom setup, device registration, upload period, and cloud platform processing. The YOUNIO manual describes testing NB-IoT signal, checking device online logs, setting initial reading, and setting upload period through a mobile CRM app. These steps show that smart metering requires field commissioning, not only factory delivery.
For LoRa or LoRaWAN systems, I check gateway placement, power supply, backhaul, obstacles, underground chambers, and platform connection. For M-Bus or RS485, I check cable design, concentrator power, address registration, and maintenance access. I do not say one communication method is best for every city.
| Architecture Layer | 내가 확인하는 것 |
|---|---|
| 미터 | 3분기, 아르 자형, 1분기, starting flow, 알람 기능 |
| 의사소통 | NB-IOT, 로라완, 무선 M-버스, RF, M-버스, RS485 |
| Field setup | 설치, 신호 테스트, device ID, initial reading |
| Network | coverage, gateway, SIM, 힘, obstacles |
| Cloud | data storage, logs, 경보 규칙, audit records |
| 청구 | account matching, tariff, validated reads |
| Customer portal | consumption view, alerts, complaint support |
Customer portals can improve transparency, but they also change complaint patterns. When customers see daily or hourly data, they ask more detailed questions. This is positive if the utility has good explanations and clear alarm rules. It is risky if the portal shows data that billing cannot explain.
A Practical Roadmap for Utilities Starting Smart City Projects?
A smart city project should not start with a huge purchase order. It should start with boundaries, pilots, and operating rules.
Utilities should begin by defining goals, meter parameters, 의사소통 방식, pilot zones, platform integration, billing rules, complaint categories, field response, and procurement documents. Full rollout should follow verified pilot results.
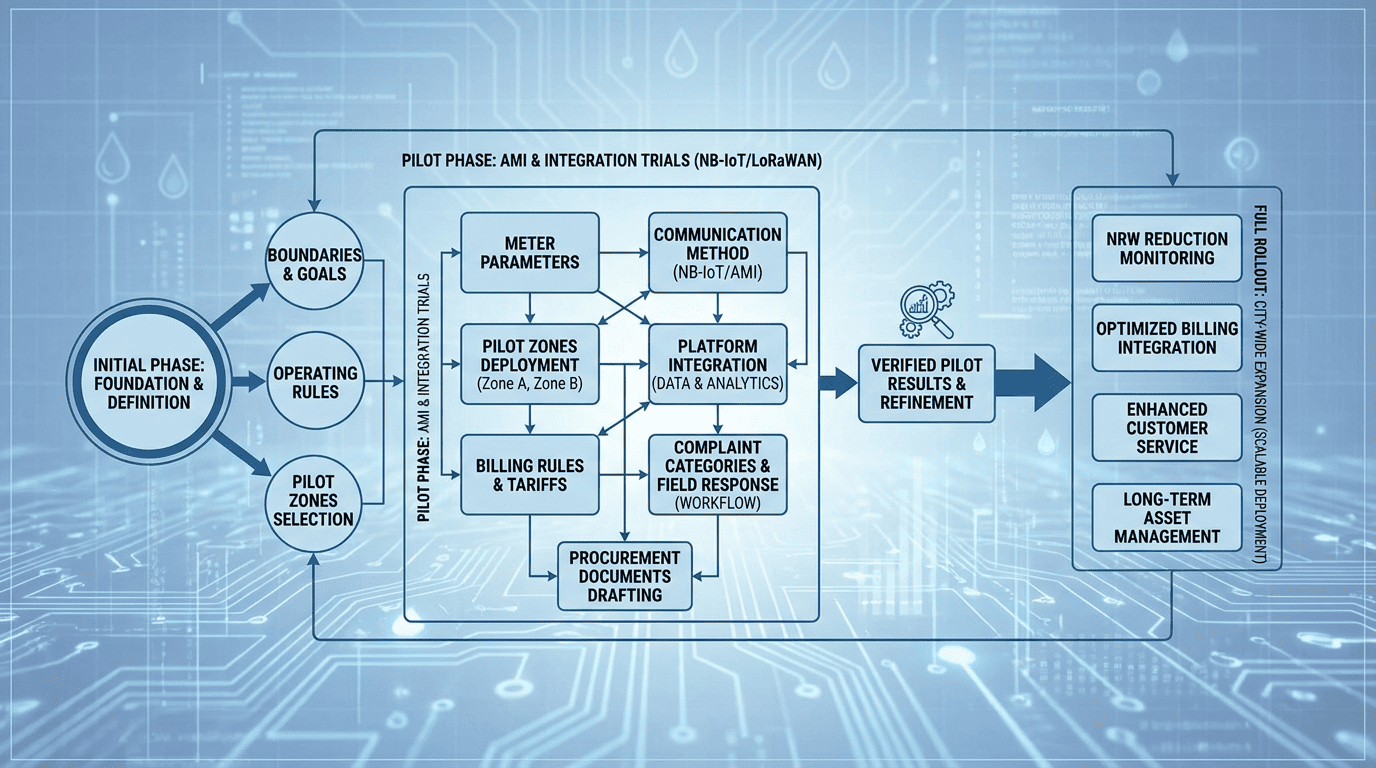
My Step-by-Step Project Method
I start with the problem statement. Is the utility trying to reduce estimated readings, support NRW reduction, improve customer transparency, reduce complaint handling time, or modernize billing? The answer affects the meter type, 의사소통 방식, data frequency, platform design, and field workflow.
Then I define the metering boundary. The tender should specify meter size, 3분기, R 값, 1분기, 시작 유량, 설치 위치, 온도 등급, 압력 조건, 보호 수준, 배터리 수명, 의사소통 방식, reporting cycle, 알람 기능, platform interface, and test documents. ISO 4064-2 is connected to ISO 4064-1 and OIML R49-1 for metrological and technical water meter requirements. It also covers testing of the complete water meter and separate testing of the measurement transducer and calculator where applicable.
다음, I run a pilot. The pilot should include different buildings, pipe materials, chambers, pressure zones, and signal conditions. I verify installation, reading accuracy under defined conditions, 신호 강도, device logs, upload period, billing import, customer portal display, and alarm response. The NB-IoT manual’s signal test, device log, and upload-period setup steps are good reminders of what must be checked in the field.
| Roadmap Step | Key Output |
|---|---|
| Define goals | NRW, 청구, complaints, transparency |
| Select pilot zones | mixed field conditions |
| Specify meters | DN, 3분기, 아르 자형, 1분기, 경보, IP level |
| Choose communication | NB-IOT, 로라완, M-버스, RF, or hybrid |
| Commission devices | 신호 테스트, initial reading, upload period |
| Integrate platform | logs, 경보, 청구, portal |
| Train teams | 공학, 그것, 청구, 고객 서비스 |
| Review pilot | complaint types, data gaps, field issues |
| Scale carefully | update tender and rollout plan |
I also define what success means. A successful smart city water metering project is not only a high reading rate. It should reduce avoidable manual visits, make complaint diagnosis faster, improve billing data quality, support NRW analysis, and create a shared data view across departments.
The final step is procurement feedback. If the pilot shows weak signal in basements, change the communication plan. If customers question leakage alarms, improve the portal explanation. If billing finds account mismatches, clean the customer database before rollout. The meter supports smart city work, but the utility must build the operating system around it.
결론
Specify smart meters, 의사소통, platform rules, billing integration, alarm workflows, and pilot verification together. Smart city value comes from data use, not meters alone.