


无收益水 (北威州) 吃公用事业预算. 我看到管理者责怪仪表, 责备用户, 和责怪管道. 真相通常隐藏在尚未有人收集的数据中.
我使用区域计量非收益水智能解决方案将猜测变成证据. Some "low reading" 投诉结果是非法管道变更或旁路, 智能电表事件日志有助于还原真实情况.
我与怀疑盗窃的公用事业公司合作, 泄漏, 或仪表错误,但无法证明其中任何一个. 无区域计量区域 (DMA) 和智能电表, 每一次抱怨都会变成一场漫长的争论. 具有 DMA 数据和事件日志, 谈话从情感转向证据. 在这篇文章中, 我分享我从问题项目中学到的东西, 我如何建立水平衡, 如何发现事件数据的非法连接, 以及我如何逐步推出 DMA.
什么是区域计量区域 (DMA)?
DMA 是一个小, 网络的可测量部分. 我将大管道图切割成我可以实际监控的部分.
我将 DMA 定义为具有已知入口和出口的区域, 每个流入量都被计量,每个大用户都被计量 提交编辑. 这让我可以将输入水量与计费水量进行比较并找到差距.

为什么我将网络分成多个区域
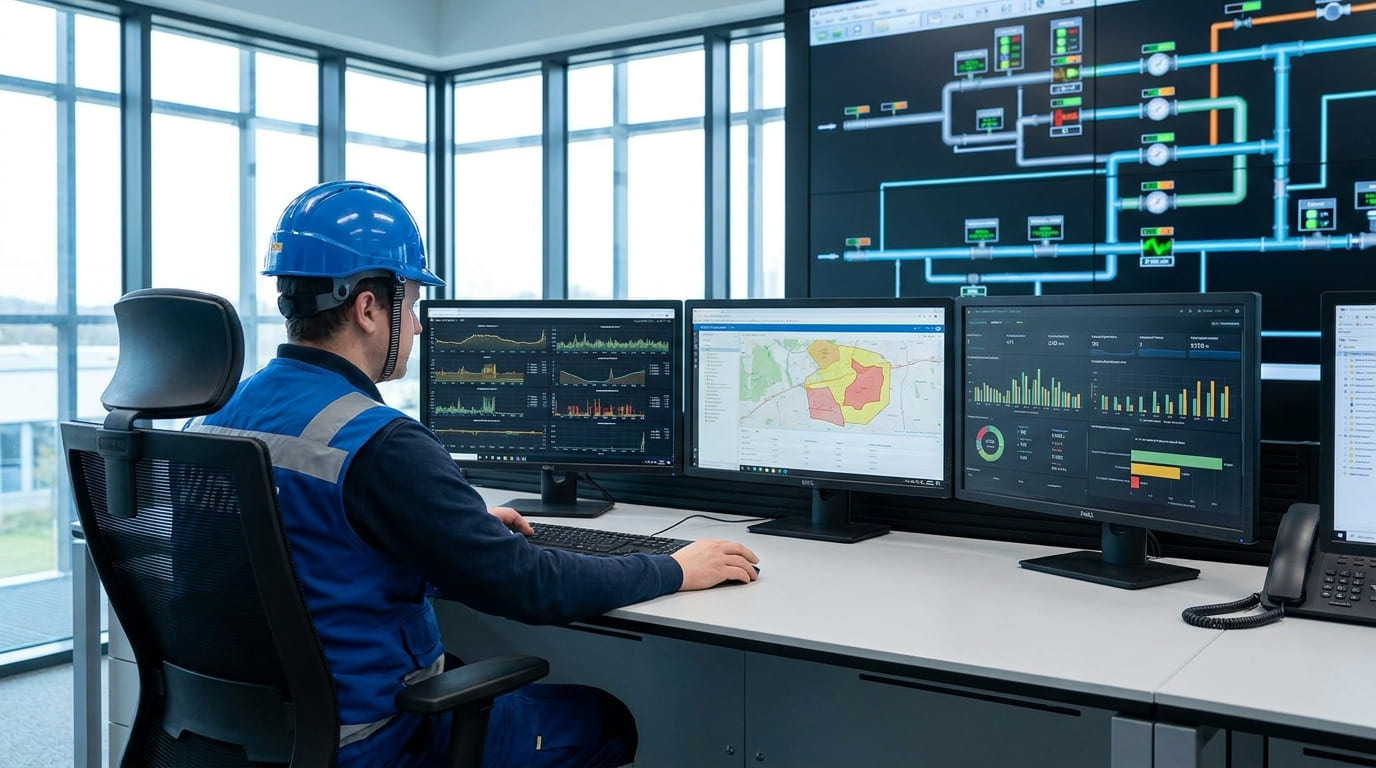
我将网络分成多个区域,因为源头的一个大仪表几乎没有告诉我任何信息. 我看不到损失发生在哪里. DMA 内部, 我在入口和关键用户处安装智能电表, 我将它们连接到监控系统. 智能超声波仪表可与GSM无线数据采集器关联,利用GSM移动公网进行数据传输,组成无线监控系统, 当管网运行异常时, 主动上报管网异常信息. 有劳拉版本, 该仪表还可以连接到集中器, 无线数据采集器利用GSM移动或以太网进行数据传输. 这种逐区域设置将盲网络变成可测量网络, 它是北威州后续每项行动的基础.
| DMA元件 | 我安装什么 | 为什么这很重要 |
|---|---|---|
| 进口 | 智能散装计量仪 | 测量总输入 |
| 大用户 | 智能子表 | 拆分已知需求 |
| 沟通 | 全球移动通信系统 / 洛拉 / 以太网 | 远程监控 |
| 警报 | 基于事件的报告 | 发现异常流量 |
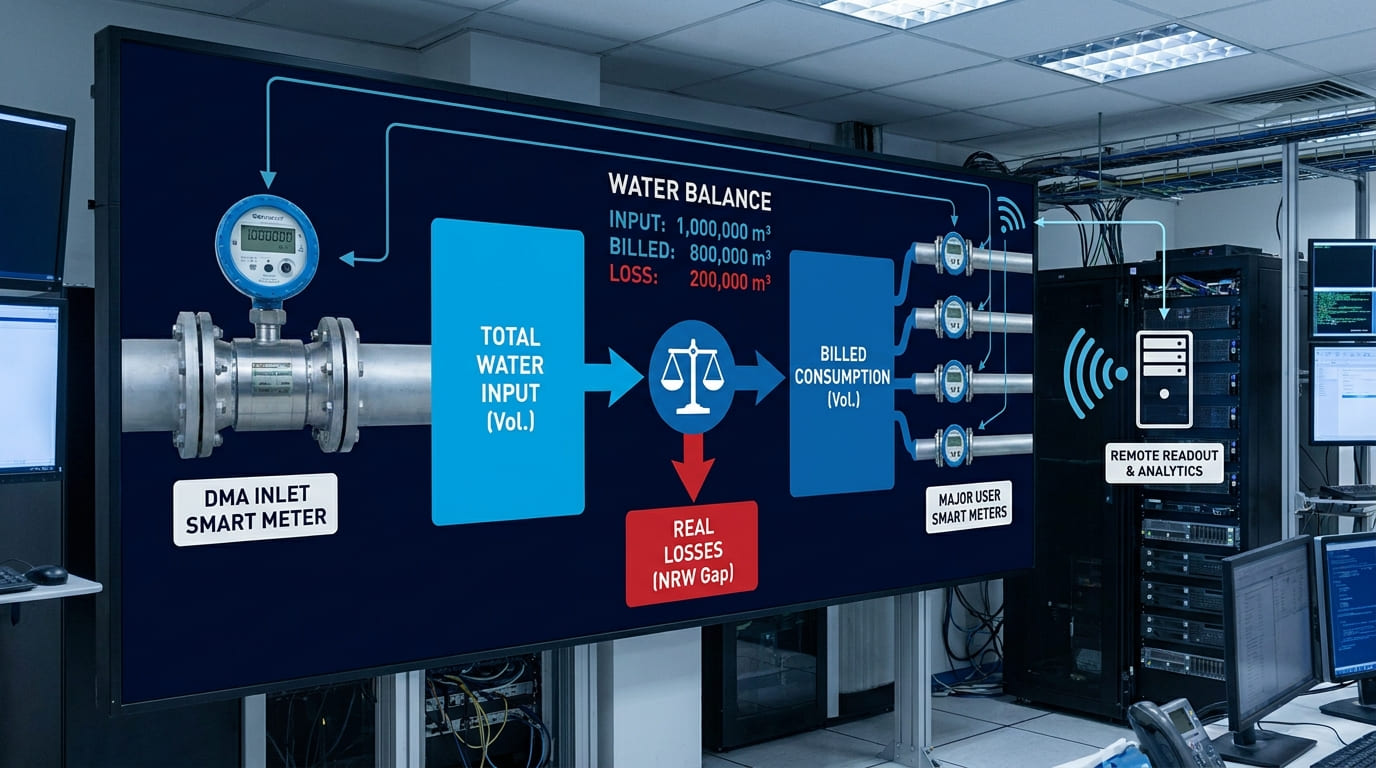
使用智能水表建立水平衡?
水平衡是所有北威州计划的核心. 输入减去计费使用等于损失, 简单来说.
我在 DMA 入口和主要用户处使用智能仪表建立水平衡, 我远程阅读它们. 输入量与计费量之间的差距显示了实际损失, 没有猜到的.
我如何收集数字
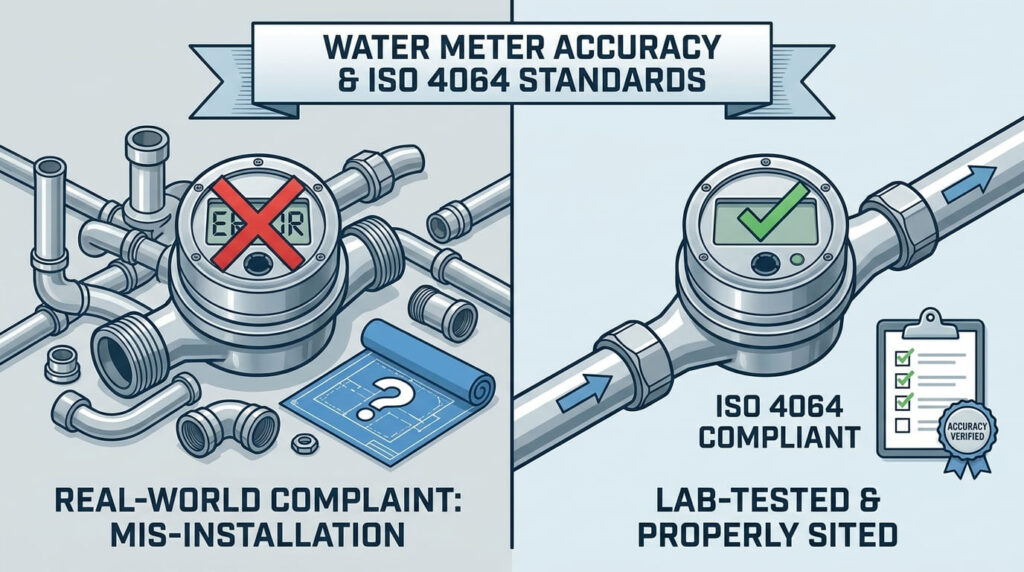
我从仪表菜单和监控系统收集数字. 每个智能电表上, 用户可以通过磁力棒切换显示屏并查看瞬时流量 (立方米/小时), 累计流量 (立方米), 屏幕检测, 表地址, 累计工作时间 (小时), 日期, 口径, 和软件版本. 对于 DMA, 我只需要两组数字: 入口累计流量与用户同期累计流量之和. 差异是我的表观损失加上实际损失. 用于远程采集, 智能电表通过GSM无线监控系统上报数据, 这节省了手动读数并为我提供了一致的时间基准. 我遵循仪表本身的标准: ISO 4064:2014, OIML R49-2013, 中, 和国标 778.1/2/3-2007 用于封闭的全管道, 安装, 和测试方法. 具有一个干净的时基和经过认证的仪表, 我的平衡在招标委员会和审计员面前是站得住脚的.
| 我需要的号码 | 来源 | 我是如何阅读的 |
|---|---|---|
| 输入音量 | DMA 入口流量计 | 累计流量 (立方米) |
| 计费量 | 用户分表 | 累计流量 (立方米) |
| 时基 | 系统时钟 | 仪表菜单上的日期 |
| 传播 | 全球移动通信系统 / 以太网 | 无线监控 |
DMA 数据揭示的典型北威州来源?
一旦 DMA 运行, 真正的损失来源很快就会显现出来. 我停止争论并开始阅读.
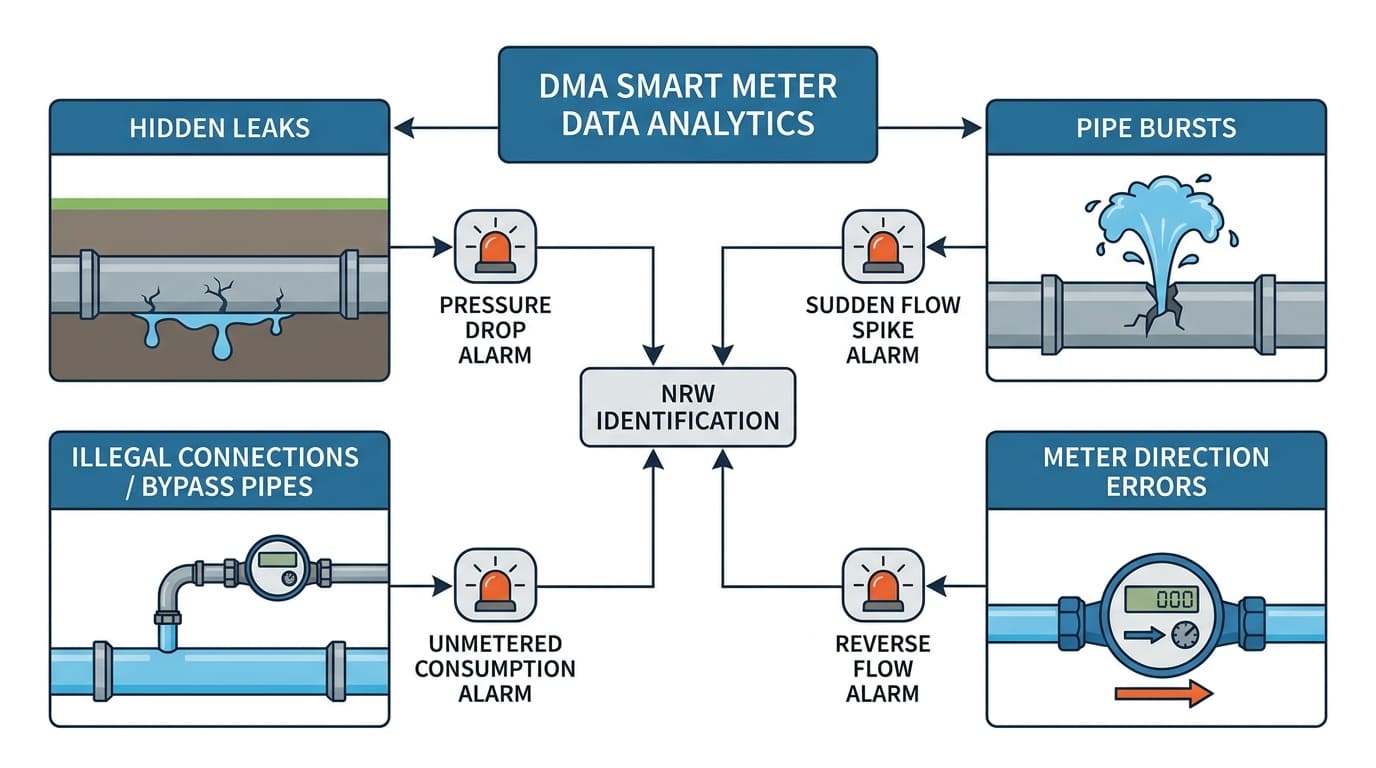
我从 DMA 数据中看到四个常见的 NRW 源: 隐藏的泄漏, 管道爆裂, 非法连接或旁路管道, 和仪表方向误差. 智能电表警报指向他们每个人.
警报实际上告诉我什么
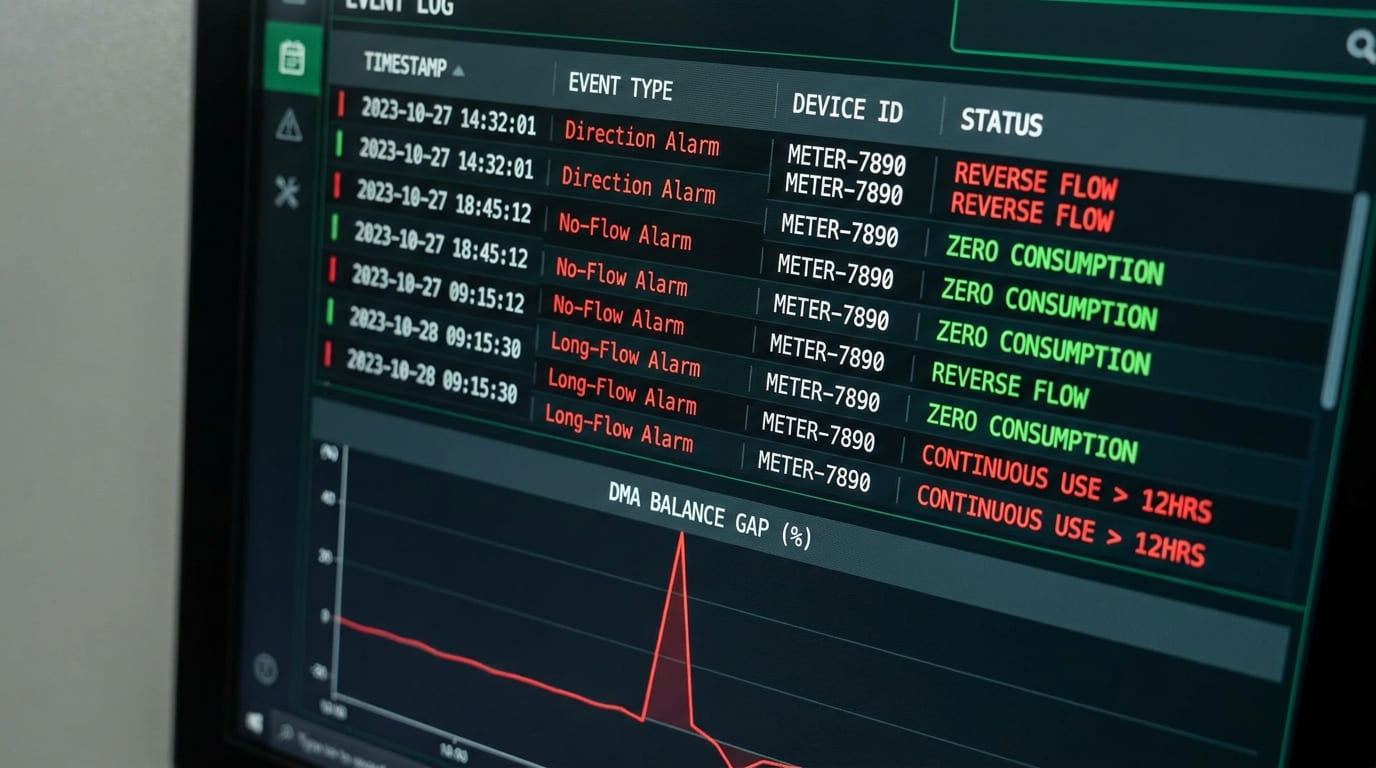
我将每个警报映射到 NRW 源. 当流量信号显示长时间流水时, 例如 24 小时, 系统主动上报错误和报警, 我将其视为管道泄漏信号. 当流量信号显示水流量较大且长时间运行时, 水量和时间由操作员设定, 系统报告并存储错误和警报, 我将其视为管道爆裂. 当水表安装方向错误时, 系统主动上报并存储错误和报警, 这经常会暴露用户端未经授权的管道更改. 当管道内无水且传感器无信号时, 系统报告, 商店, 还有警报, 这有助于我捕获干燥部分或关闭的阀门. 每个警报将抽象的 NRW 号码转换为具体的现场票证.
| 北威州来源 | 使用警报 | 典型的根本原因 |
|---|---|---|
| 隐藏泄漏 | 长流报警 (24小时) | 埋地管道裂纹 |
| 爆裂 | 大流量报警 | 主要休息 |
| 非法连接 | 方向报警 | 反向或旁路管道 |
| 封闭/空部分 | 无流量报警 | 阀门或干线 |
寻找可靠的水表供应商?
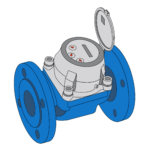
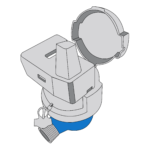
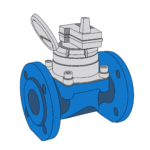
YOUNIO 生产 DN15 至 DN500 机械水表和超声波水表, 经过 MID 认证和 ISO 测试 4064. 为合格买家提供免费样品和工厂测试报告.
案例研究: 从怀疑到数据驱动的证明?
我见过工作人员多年来怀疑盗窃的项目. 没有数据, 他们无法采取行动. 具有 DMA 和智能电表, 几周后真相大白.
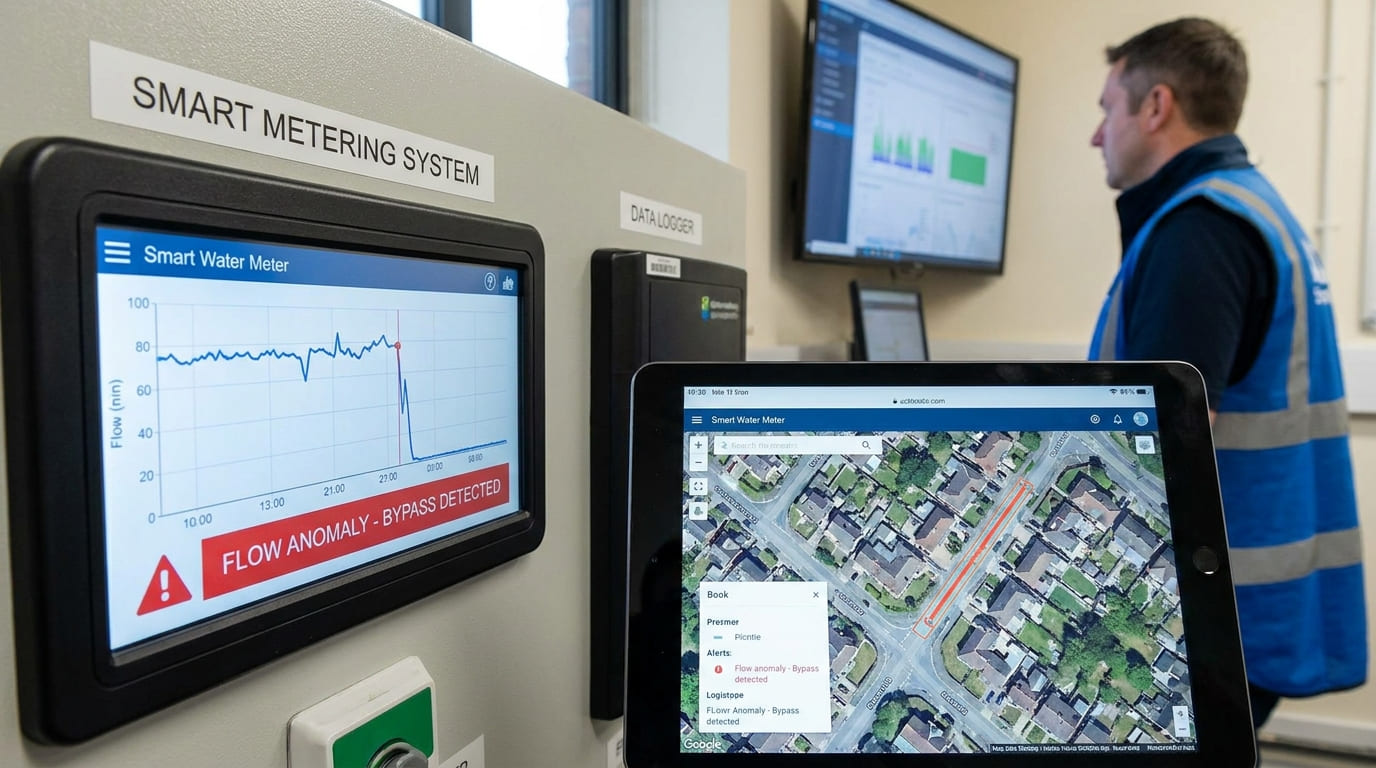
I use case patterns where "low reading" 投诉看起来像是水表故障,但结果是非法管道更换或旁路. 智能电表事件日志还原了真实情况并保护了公用事业公司的声誉.
我一次又一次遇到的模式
我描述了我在问题项目中遇到的三种模式. 在第一个, 用户抱怨新安装后仪表读数太低. 现场检查显示仪表方向警报已触发, 意味着仪表安装方向错误, 未经授权的管道施工后可能会发生这种情况. 在第二个, DMA 显示稳定的夜间流量,没有降至接近零. 特定分表处的长流警报表明存在埋藏泄漏 24 连续流动小时数. 在第三个, 大用户累计流量看上去很正常, 但DMA余额仍然出现大幅亏损. 通过读取每个智能仪表的菜单——瞬时流量, 累计流量, 工作时间, 和日期——我发现一米几乎没有工作时间, 暗示有旁通管供应未计量的水. 在每种情况下, 我从怀疑转向证明,因为仪表主动存储和报告事件.
| 怀疑 | 数据证明了这一点 | 行动 |
|---|---|---|
| 仪表太低 | 方向报警 | 重新安装, 审计管道 |
| 隐藏的废物 | 长流报警 | 查找并修复泄漏 |
| 旁通管 | 仪表工作时间短 | 检查用户场所 |
使用事件和警报来发现非法连接?
非法连接和绕行是北威州最难对付的来源. 我需要用户无法反驳的数据.
我使用智能电表事件——方向警报, 无流量警报, 长流量警报 — 加上 DMA 平衡间隙以指向非法连接. 存储的事件日志为我提供了在争议中有效的时间表.
我如何建立证据链
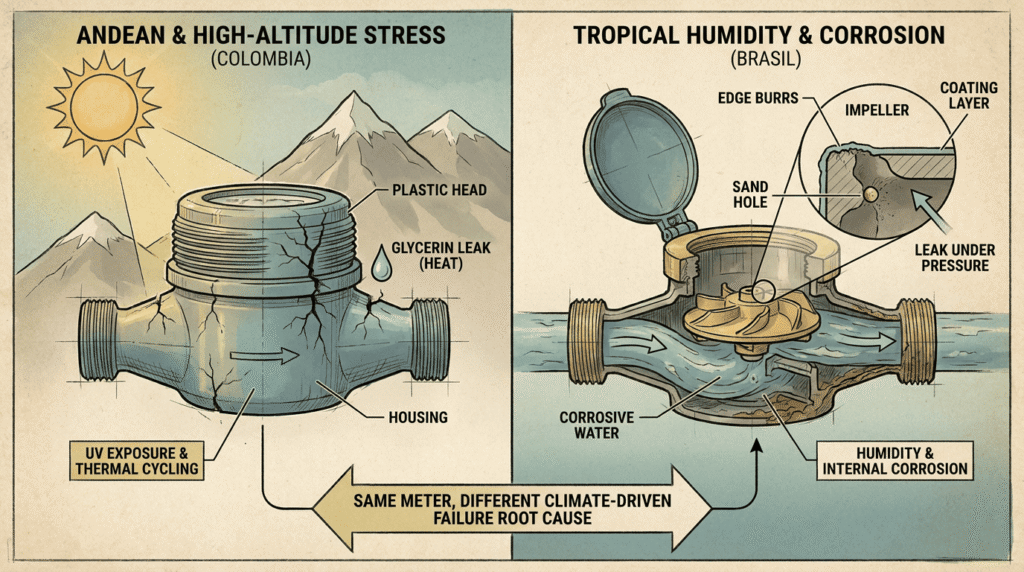
我从三层构建了一个证据链. 第一层是仪表本身. 智能超声波表主动向监控系统上报管网异常信息, 并且电池状态也可见: 当电池电量低时, LCD显示低电量符号并向管理系统报告信息. 第二层是事件类型. 流向检测报告反向事件, 这是篡改或绕过的强烈迹象. 流量检测报告无信号事件, 这可以帮助我检查是否有人关闭了阀门并打开了未计量的路径. 管道泄漏检测和爆裂检测在时间窗口周围添加上下文. 第三层是DMA平衡. 如果入口体积与用户体积总和不匹配, 并且用户同时有方向报警, 我已对齐证据. 因为安装必须遵循现场专业工程设计,未经工程师许可严禁改动, 任何未经授权的变更均构成明显的合同违约.
| 证据层 | 数据点 | 为什么这很重要 |
|---|---|---|
| 仪表 | 主动异常报告 | 实时信号 |
| 事件 | 方向 / 无流量报警 | 篡改指示器 |
| 平衡 | DMA 入口 vs. 用户总数 | 量化差距 |
| 规则 | 工程设计合规性 | 法律依据 |
北威州项目 KPI 框架?
没有 KPI, 北威州项目发生变化. 我设置了一小组数字并每月跟踪它们.
我对 NRW 项目使用一个简短的 KPI 框架: DMA 输入量, 计费量, 损失量, 按类型划分的警报计数, 和仪表数据上传速率. 智能电表菜单和监控系统直接提供这些 KPI.
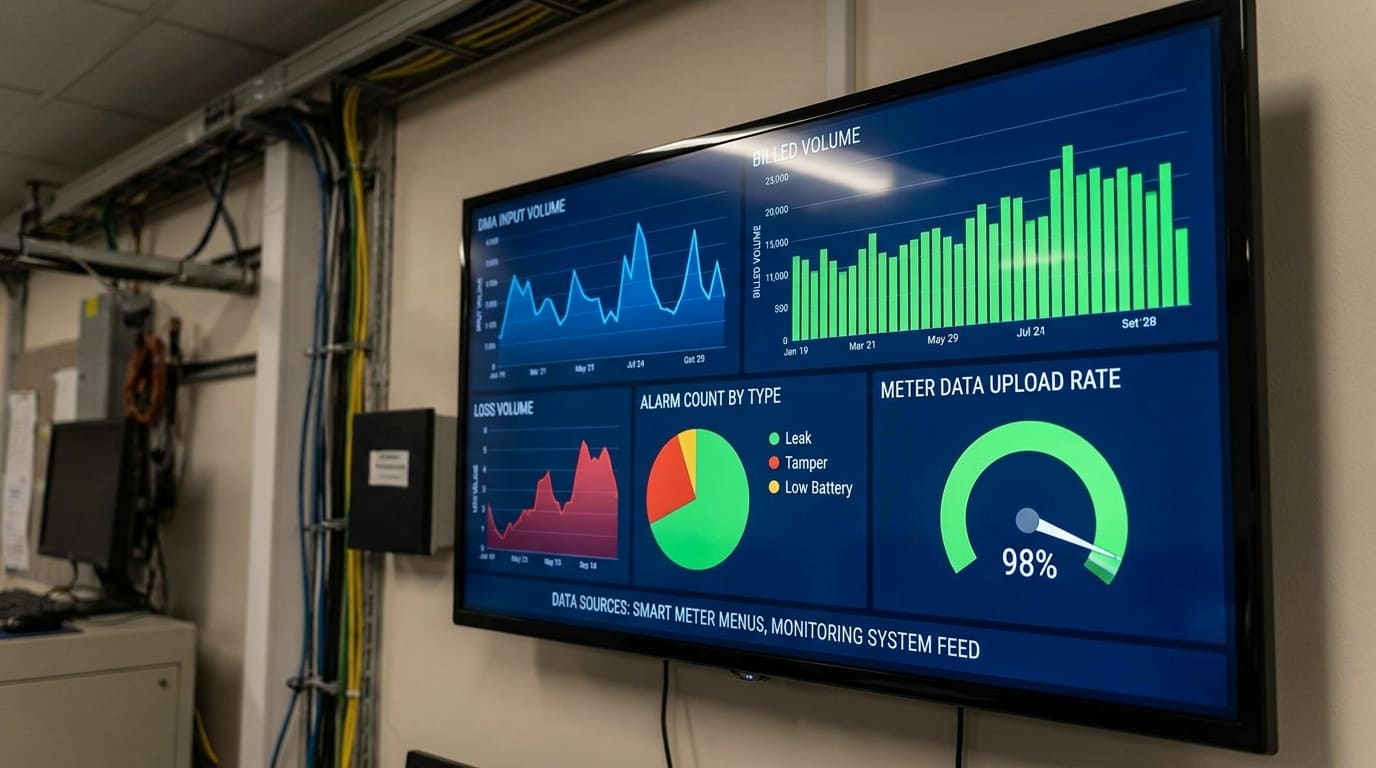
我跟踪的 KPI 及其来源
我将 KPI 设置得很短,以便团队实际使用它. 输入量和计费量来自累积流量 (立方米) 在 DMA 入口仪表和用户子仪表上, 通过菜单或远程阅读. 损失量只需输入减去同期计费即可. 监控系统按类型报警计数, 接收主动泄漏报告, 爆发, 方向错误, 和无流量事件. 仪表数据上传速率也很重要, 因为丢失的数据会造成损失. 智能电表通过GSM无线系统主动上报异常信息, Lora 版本可以通过 GSM 移动或以太网连接到集中器. 我还跟踪电池健康状况, 因为低电量会通过专用符号报告给系统, 错过的报告通常可以追溯到应该更换电池的仪表. 标准如 ISO 4064:2014, OIML R49-2013, 和 MID 为我提供每个 KPI 一致的准确性参考.
| 关键绩效指标 | 来源 | 为什么我追踪它 |
|---|---|---|
| 输入音量 | DMA 入口流量计 | 平衡顶部 |
| 计费量 | 用户分表 | 平衡底部 |
| 报警计数 | 监控系统 | 北威州根本原因 |
| 上传率 | 通讯日志 | 数据可靠性 |
| 电池状态 | 液晶显示屏 + 系统报告 | 防止数据丢失 |
分步 DMA 实施路线图?
当实用程序尝试同时执行所有操作时,DMA 程序会失败. 我总是分阶段推出.
我遵循分步路线图: 选择一个试验区, 定义入口和出口, 安装经过认证的智能电表, 连接监控系统, 进行几个月的水平衡, 然后扩展到更多区域.
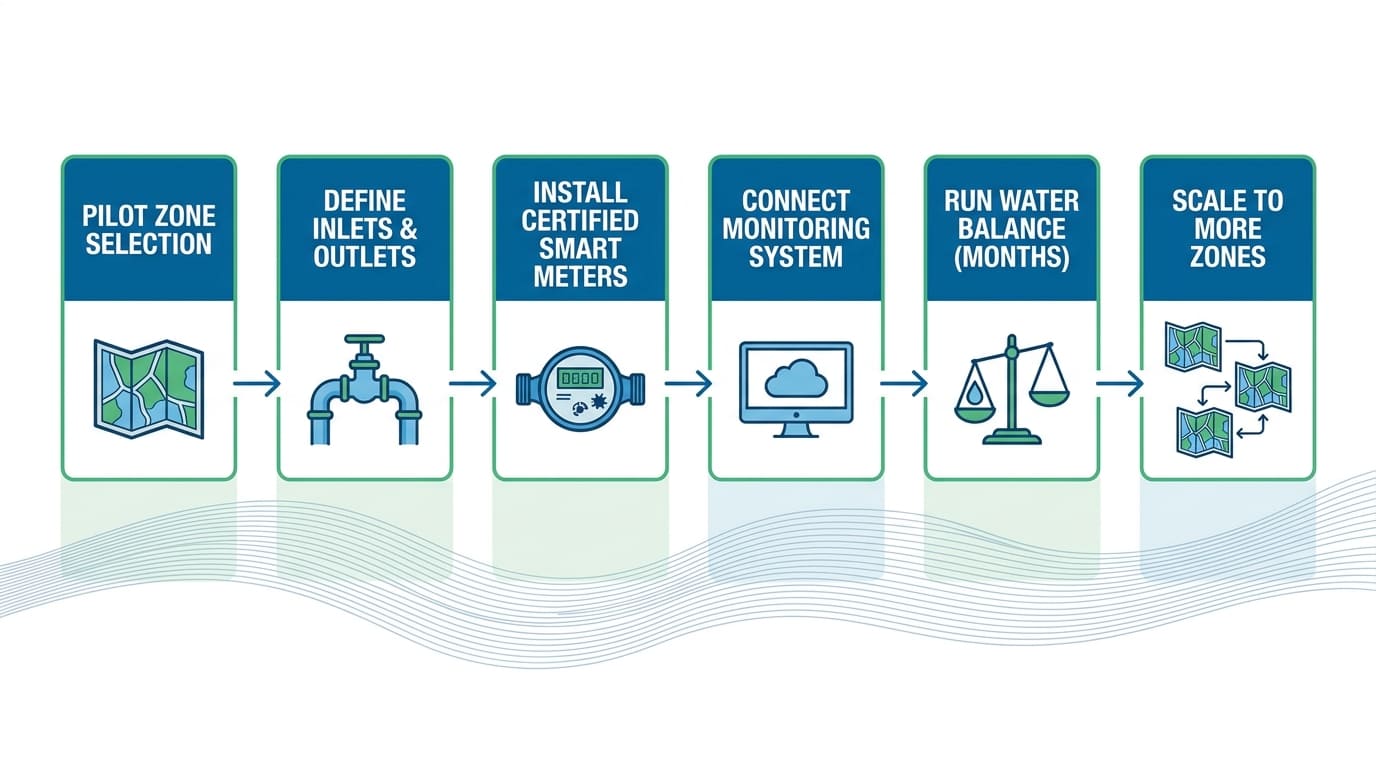
我推荐的阶段
我将路线图分为五个阶段. 第一阶段是区域选择: 我选择边界清晰且已知大用户的 DMA. 第二阶段是仪表选择: 我使用符合 ISO 的智能超声波测量仪 4064:2014, OIML R49-2013, 中, 和国标 778.1/2/3-2007 用于测量, 安装, 和测试方法. 第三阶段是安装, 必须严格按照现场专业工程设计, 未经工程师许可不得改动. 第四阶段是沟通: 我将仪表连接到 GSM 无线数据采集器或通过 LoRa 连接到集中器, 从而系统形成完整的无线监控设置,主动报告异常信息. 第五阶段是运营阶段: 我每月进行一次水平衡, 追踪警报, 并对每个事件采取行动——泄漏的长流程, 大流量突发, 方向篡改警报, 干燥部分不流动. 只有在试点 DMA 显示稳定数据后,我才会扩展到下一个区域.
| 阶段 | 主要动作 | 关键参考 |
|---|---|---|
| 1. 选择区域 | 清除入口/出口 | 直接存储器存取设计 |
| 2. 选择仪表 | 经过认证的智能电表 | ISO 4064 / 中 |
| 3. 安装 | 遵循工程设计 | 未经授权不得更改 |
| 4. 交流 | 全球移动通信系统 / 洛拉 / 以太网 | 无线监控 |
| 5. 操作 | 每月余额 + 警报 | 基于事件的行动 |
结论
DMA 加上智能电表事件日志将 NRW 从猜疑游戏转变为数据驱动程序, 每一次损失都有一个名字, 一个地点, 和一个动作.
寻找可靠的水表供应商?
YOUNIO 生产 DN15 至 DN500 机械水表和超声波水表, 经过 MID 认证和 ISO 测试 4064. 为合格买家提供免费样品和工厂测试报告.